

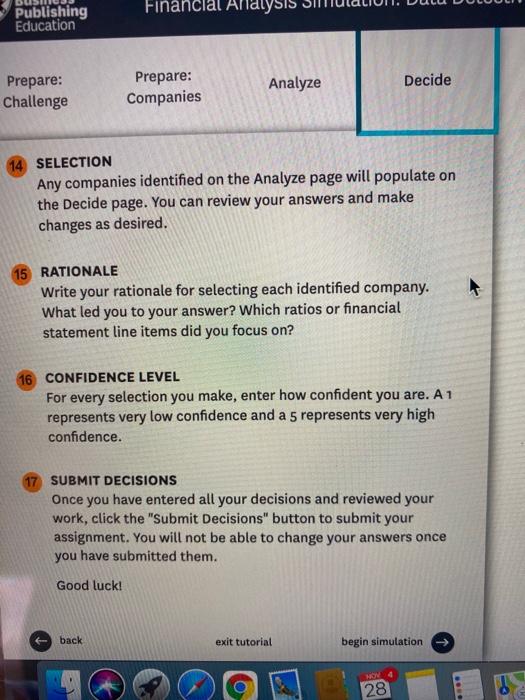
Question: select which company matches each financial statement. Filter Builder OFF B D E Cell Highlighter SELECT SELECT SELECTV SELECT SELECT : 0.4% 6.1% 59.4% 11.4%
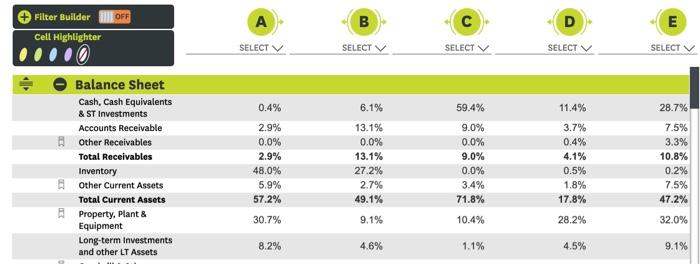
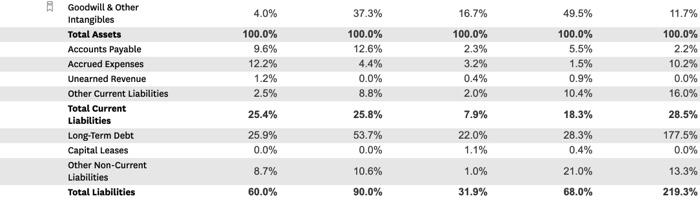
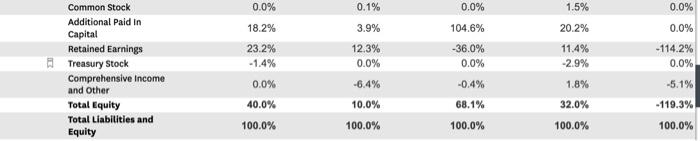
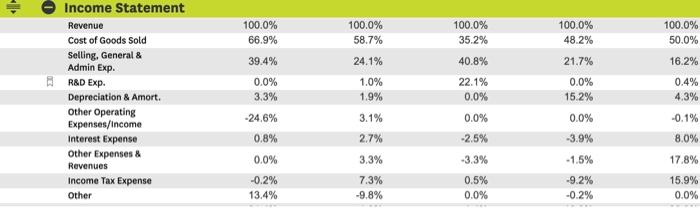
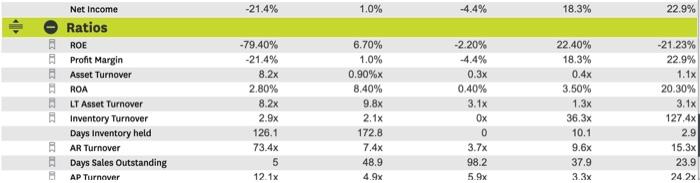
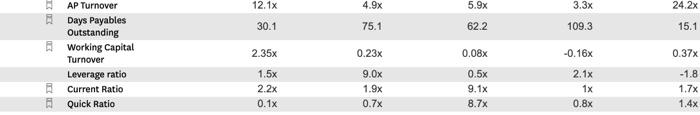
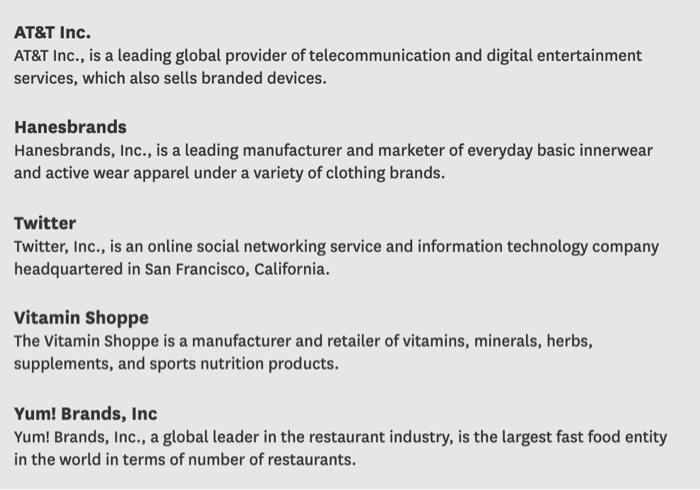
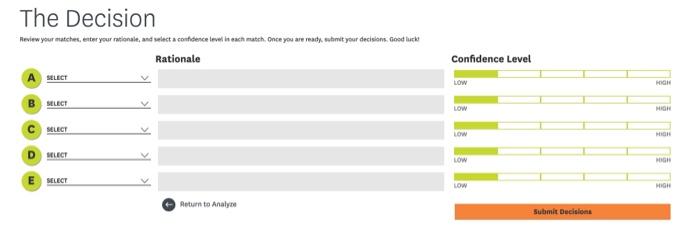
Filter Builder OFF B D E Cell Highlighter SELECT SELECT SELECTV SELECT SELECT : 0.4% 6.1% 59.4% 11.4% 28.7% Balance Sheet Cash, Cash Equivalents & ST Investments Accounts Receivable Other Receivables Total Receivables Inventory Other Current Assets Total Current Assets Property, Plant & Equipment Long-term Investments and other LT Assets 2.9% 0.0% 2.9% 48.0% 5.9% 57.2% 13.1% 0.0% 13.1% 27.2% 2.7% 49.1% 9.0% 0.0% 9.0% 0.0% 3.4% 71.8% 3.7% 0.4% 4.1% 0.5% 1.8% 17.8% 7.5% 3.3% 10.8% 0.2% 7.5% 47.2% 30.7% 9.1% 10.4% 28.2% 32.0% 8.2% 4.6% 1.1% 4.5% 9.1% 4.0% 37.3% 16.7% 49.5% 11.7% 100.0% 9.6% 12.2% 1.2% 2.5% 100.0% 12.6% 4.4% 0.0% 8.8% 100.0% 2.3% 3.2% 0.4% 2.0% 100.0% 5.5% 1.5% 0.9% 10.4% 100.0% 2.2% 10.2% 0.0% 16.0% Goodwill & Other Intangibles Total Assets Accounts Payable Accrued expenses Unearned Revenue Other Current Liabilities Total Current Liabilities Long-Term Debt Capital Leases Other Non-Current Liabilities Total Liabilities 25.4% 25.8% 7.9% 18.3% 28.5% 25.9% 0.0% 53.7% 0.0% 22.0% 1.1% 28.3% 0.4% 177.5% 0.0% 8.7% 10.6% 1.0% 21.0% 13.3% 60.0% 90.0% 31.9% 68.0% 219.3% 0.0% 0.1% 1.5% 0.0% 3.9% 20.2% 0.0% 18.2% 23.2% -1.4% 0.0% 104.6% -36.0% 0.0% 12.3% 0.0% 11.4% -2.9% - 114.2% 0.0% Common Stock Additional Paid in Capital Retained Earnings Treasury Stock Comprehensive Income and Other Total Equity Total Liabilities and Equity -0.4% 1.8% 0.0% 40.0% -6.4% 10.0% -5.1% -119.3% 32.0% 68.1% 100.0% 100.0% 100.0% 100.0% 100.0% 100.0% 66.9% 100.0% 58.7% 100.0% 35.2% 100.0% 48.2% 100.0% 50.0% 39.4% 24.1% 40.8% 21.7% 16.2% Income Statement Revenue Cost of Goods Sold Selling, General & Admin Exp. R&D Exp. Depreciation & Amort. Other Operating Expenses/income Interest Expense Other Expenses & Revenues Income Tax Expense Other 0.0% 3.3% 1.0% 1.9% 22.1% 0.0% 0.0% 15.2% 0.4% 4.3% -24.6% 3.1% 0.0% 0.0% -0.1% 0.8% 2.7% -2.5% -3.9% 8.0% 0.0% 3,3% -0.2% 13.4% 7.3% -9.8% -3.3% 0.5% 0.0% -1.5% -9.2% -0.2% 17.8% 15.9% 0.0% -21.4% 1.0% -4.4% 18.3% 22.9% 1 EEEEE Net Income Ratios ROE Profit Margin Asset Turnover ROA LT Asset Turnover Inventory Turnover Days Inventory held AR Turnover Days Sales Outstanding AP Turnover -79.40% -21.4% 8.2x 2.80% 8.2x 2.9x 126.1 73.4x 5 12.1x 6.70% 1.0% 0.90%x 8.40% 9.8x 2.1x 172.8 7.4x 48.9 4.9% -2.20% -4.4% 0.3x 0.40% 3.1x Ox 0 3.7x 98.2 5.9x 22.40% 18.3% 0.4x 3.50% 1.3x 36.3x 10.1 9.6x 37.9 3.3x -21.23% 22.9% 1.1x 20.30% 3.1x 127.4x 2.9 15.3% 23.9 24 2x 12.1x 4.9x 5.9x 3.3x 24.2x 30.1 75.1 62.2 109.3 15.1 AP Turnover Days Payables Outstanding A Working Capital Turnover Leverage ratio Current Ratio A Quick Ratio 2.35x 0.23x 0.08x -0.16x 0.37x 1.5x 2.2x 0.1% 9.Ox 1.9x 0.7x 0.5x 9.1x 8.7x 2.1x 1x 0.8x -1.8 1.7x 1.4x AT&T Inc. AT&T Inc., is a leading global provider of telecommunication and digital entertainment services, which also sells branded devices. Hanesbrands Hanesbrands, Inc., is a leading manufacturer and marketer of everyday basic innerwear and active wear apparel under a variety of clothing brands. Twitter Twitter, Inc., is an online social networking service and information technology company headquartered in San Francisco, California. Vitamin Shoppe The Vitamin Shoppe is a manufacturer and retailer of vitamins, minerals, herbs, supplements, and sports nutrition products. Yum! Brands, Inc Yum! Brands, Inc., a global leader in the restaurant industry, is the largest fast food entity in the world in terms of number of restaurants. The Decision Review your matches, enter your rational, and select a confidence level in each match. Once you are ready, it your decision. Good luck Rationale A SELECT Confidence Level LOW HIGH B SELECT LOW HIGH CHUCY LOW D SELECT LOW E SELECT LOW HIGH Return to Analye Submit Decisions Financial Analysis Publishing Education Prepare: Challenge Prepare: Companies Analyze Decide 14 SELECTION Any companies identified on the Analyze page will populate on the Decide page. You can review your answers and make changes as desired. 15 RATIONALE Write your rationale for selecting each identified company. What led you to your answer? Which ratios or financial statement line items did you focus on? 16 CONFIDENCE LEVEL For every selection you make, enter how confident you are. A 1 represents very low confidence and a 5 represents very high confidence. 17 SUBMIT DECISIONS Once you have entered all your decisions and reviewed your work, click the "Submit Decisions" button to submit your assignment. You will not be able to change your answers once you have submitted them. Good luck! back exit tutorial begin simulation WON 28 Filter Builder OFF B D E Cell Highlighter SELECT SELECT SELECTV SELECT SELECT : 0.4% 6.1% 59.4% 11.4% 28.7% Balance Sheet Cash, Cash Equivalents & ST Investments Accounts Receivable Other Receivables Total Receivables Inventory Other Current Assets Total Current Assets Property, Plant & Equipment Long-term Investments and other LT Assets 2.9% 0.0% 2.9% 48.0% 5.9% 57.2% 13.1% 0.0% 13.1% 27.2% 2.7% 49.1% 9.0% 0.0% 9.0% 0.0% 3.4% 71.8% 3.7% 0.4% 4.1% 0.5% 1.8% 17.8% 7.5% 3.3% 10.8% 0.2% 7.5% 47.2% 30.7% 9.1% 10.4% 28.2% 32.0% 8.2% 4.6% 1.1% 4.5% 9.1% 4.0% 37.3% 16.7% 49.5% 11.7% 100.0% 9.6% 12.2% 1.2% 2.5% 100.0% 12.6% 4.4% 0.0% 8.8% 100.0% 2.3% 3.2% 0.4% 2.0% 100.0% 5.5% 1.5% 0.9% 10.4% 100.0% 2.2% 10.2% 0.0% 16.0% Goodwill & Other Intangibles Total Assets Accounts Payable Accrued expenses Unearned Revenue Other Current Liabilities Total Current Liabilities Long-Term Debt Capital Leases Other Non-Current Liabilities Total Liabilities 25.4% 25.8% 7.9% 18.3% 28.5% 25.9% 0.0% 53.7% 0.0% 22.0% 1.1% 28.3% 0.4% 177.5% 0.0% 8.7% 10.6% 1.0% 21.0% 13.3% 60.0% 90.0% 31.9% 68.0% 219.3% 0.0% 0.1% 1.5% 0.0% 3.9% 20.2% 0.0% 18.2% 23.2% -1.4% 0.0% 104.6% -36.0% 0.0% 12.3% 0.0% 11.4% -2.9% - 114.2% 0.0% Common Stock Additional Paid in Capital Retained Earnings Treasury Stock Comprehensive Income and Other Total Equity Total Liabilities and Equity -0.4% 1.8% 0.0% 40.0% -6.4% 10.0% -5.1% -119.3% 32.0% 68.1% 100.0% 100.0% 100.0% 100.0% 100.0% 100.0% 66.9% 100.0% 58.7% 100.0% 35.2% 100.0% 48.2% 100.0% 50.0% 39.4% 24.1% 40.8% 21.7% 16.2% Income Statement Revenue Cost of Goods Sold Selling, General & Admin Exp. R&D Exp. Depreciation & Amort. Other Operating Expenses/income Interest Expense Other Expenses & Revenues Income Tax Expense Other 0.0% 3.3% 1.0% 1.9% 22.1% 0.0% 0.0% 15.2% 0.4% 4.3% -24.6% 3.1% 0.0% 0.0% -0.1% 0.8% 2.7% -2.5% -3.9% 8.0% 0.0% 3,3% -0.2% 13.4% 7.3% -9.8% -3.3% 0.5% 0.0% -1.5% -9.2% -0.2% 17.8% 15.9% 0.0% -21.4% 1.0% -4.4% 18.3% 22.9% 1 EEEEE Net Income Ratios ROE Profit Margin Asset Turnover ROA LT Asset Turnover Inventory Turnover Days Inventory held AR Turnover Days Sales Outstanding AP Turnover -79.40% -21.4% 8.2x 2.80% 8.2x 2.9x 126.1 73.4x 5 12.1x 6.70% 1.0% 0.90%x 8.40% 9.8x 2.1x 172.8 7.4x 48.9 4.9% -2.20% -4.4% 0.3x 0.40% 3.1x Ox 0 3.7x 98.2 5.9x 22.40% 18.3% 0.4x 3.50% 1.3x 36.3x 10.1 9.6x 37.9 3.3x -21.23% 22.9% 1.1x 20.30% 3.1x 127.4x 2.9 15.3% 23.9 24 2x 12.1x 4.9x 5.9x 3.3x 24.2x 30.1 75.1 62.2 109.3 15.1 AP Turnover Days Payables Outstanding A Working Capital Turnover Leverage ratio Current Ratio A Quick Ratio 2.35x 0.23x 0.08x -0.16x 0.37x 1.5x 2.2x 0.1% 9.Ox 1.9x 0.7x 0.5x 9.1x 8.7x 2.1x 1x 0.8x -1.8 1.7x 1.4x AT&T Inc. AT&T Inc., is a leading global provider of telecommunication and digital entertainment services, which also sells branded devices. Hanesbrands Hanesbrands, Inc., is a leading manufacturer and marketer of everyday basic innerwear and active wear apparel under a variety of clothing brands. Twitter Twitter, Inc., is an online social networking service and information technology company headquartered in San Francisco, California. Vitamin Shoppe The Vitamin Shoppe is a manufacturer and retailer of vitamins, minerals, herbs, supplements, and sports nutrition products. Yum! Brands, Inc Yum! Brands, Inc., a global leader in the restaurant industry, is the largest fast food entity in the world in terms of number of restaurants. The Decision Review your matches, enter your rational, and select a confidence level in each match. Once you are ready, it your decision. Good luck Rationale A SELECT Confidence Level LOW HIGH B SELECT LOW HIGH CHUCY LOW D SELECT LOW E SELECT LOW HIGH Return to Analye Submit Decisions Financial Analysis Publishing Education Prepare: Challenge Prepare: Companies Analyze Decide 14 SELECTION Any companies identified on the Analyze page will populate on the Decide page. You can review your answers and make changes as desired. 15 RATIONALE Write your rationale for selecting each identified company. What led you to your answer? Which ratios or financial statement line items did you focus on? 16 CONFIDENCE LEVEL For every selection you make, enter how confident you are. A 1 represents very low confidence and a 5 represents very high confidence. 17 SUBMIT DECISIONS Once you have entered all your decisions and reviewed your work, click the "Submit Decisions" button to submit your assignment. You will not be able to change your answers once you have submitted them. Good luck! back exit tutorial begin simulation WON 28
Step by Step Solution
There are 3 Steps involved in it

Get step-by-step solutions from verified subject matter experts