

Question: Selected comparative financial statement data for Espresso Inc. are shown below. ESPRESSO INC. Statement of Financial Position (partial) December 31 (in thousands) 2024 2023
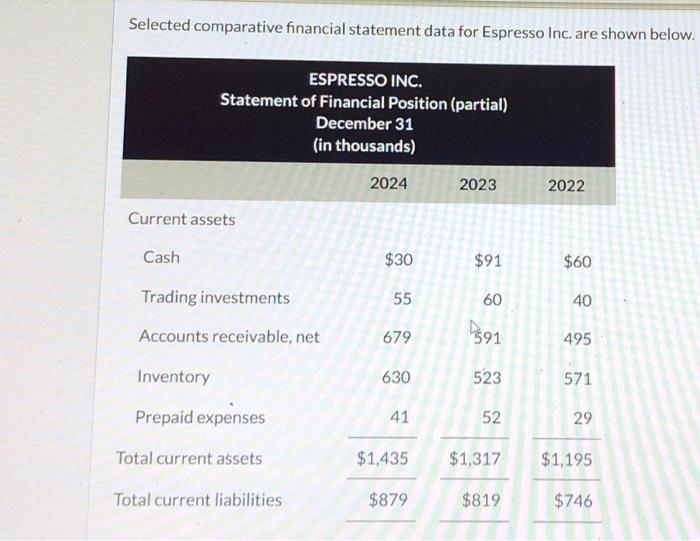
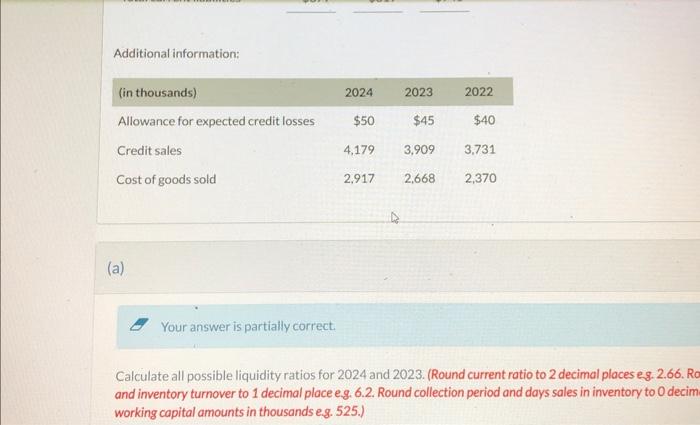
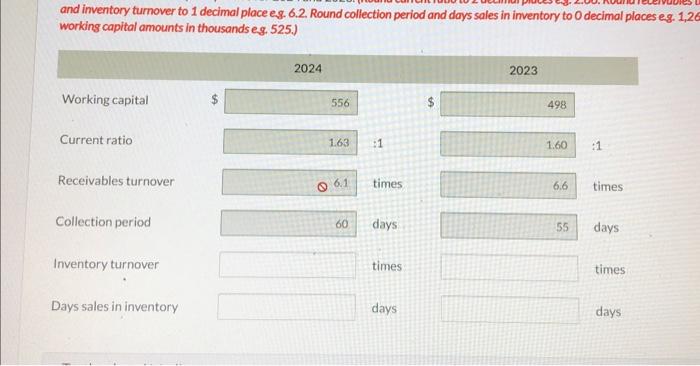
Selected comparative financial statement data for Espresso Inc. are shown below. ESPRESSO INC. Statement of Financial Position (partial) December 31 (in thousands) 2024 2023 2022 Current assets Cash $30 $91 $60 Trading investments 55 60 40 Accounts receivable, net 679 $591 495 Inventory 630 523 571 Prepaid expenses 41 52 29 Total current assets $1,435 $1,317 $1,195 Total current liabilities $879 879 $8 $819 $746 Additional information: (in thousands) 2024 2023 2022 Allowance for expected credit losses $50 $45 $40 Credit sales 4,179 3,909 3,731 Cost of goods sold 2,917 2,668 2,370 (a) Your answer is partially correct. Calculate all possible liquidity ratios for 2024 and 2023. (Round current ratio to 2 decimal places e.g. 2.66. Rom and inventory turnover to 1 decimal place e.g. 6.2. Round collection period and days sales in inventory to O decim working capital amounts in thousands e.g. 525.) and inventory turnover to 1 decimal place e.g. 6.2. Round collection period and days sales in inventory to O decimal places eg. 1,26 working capital amounts in thousands eg. 525.) 2024 2023 Working capital 556 498 Current ratio 1.63 :1 1.60 :1 Receivables turnover Q6.1 times 6.6 times Collection period 60 days 55 days Inventory turnover times times Days sales in inventory days days
Step by Step Solution
There are 3 Steps involved in it

Get step-by-step solutions from verified subject matter experts