

Question: Selected financial data for Quick Sell, Inc., a retail store, appear as follows. Sales (all on account) Cost of goods sold Average inventory during the
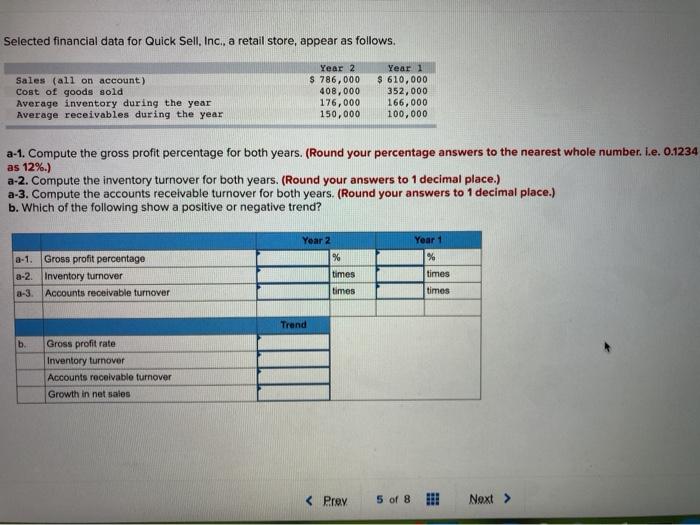
Selected financial data for Quick Sell, Inc., a retail store, appear as follows. Sales (all on account) Cost of goods sold Average inventory during the year Average receivables during the year Year 2 $ 786,000 408,000 176,000 150,000 Year 1 $ 610,000 352,000 166,000 100,000 a-1. Compute the gross profit percentage for both years. (Round your percentage answers to the nearest whole number. I.e. 0.1234 as 12%.) a-2. Compute the inventory turnover for both years. (Round your answers to 1 decimal place.) a-3. Compute the accounts receivable turnover for both years. (Round your answers to 1 decimal place.) b. Which of the following show a positive or negative trend? Year 2 % Year 1 % 0-1. Gross profit percentago a-2. Inventory turnover Accounts receivable turnover times times times times Trend b Gross profit rate Inventory turnover Accounts receivable turnover Growth in net sales Prey 5 of 8 Next >
Step by Step Solution
There are 3 Steps involved in it

Get step-by-step solutions from verified subject matter experts