

Question: Selected financial data for Quick Sell, Inc., a retail store, appear as follows. Sales (all on account) Cost of goods sold Average Inventory during the
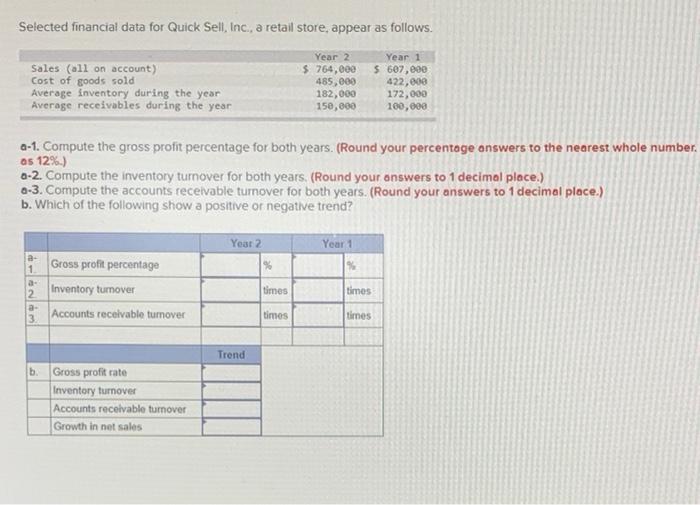
Selected financial data for Quick Sell, Inc., a retail store, appear as follows. Sales (all on account) Cost of goods sold Average Inventory during the year Average receivables during the year Year 2 $ 764,000 485,000 182,000 150,000 Year 1 $ 607,000 422,000 172,000 100,000 a-1. Compute the gross profit percentage for both years. (Round your percentage answers to the nearest whole number. as 12%) 0-2. Compute the inventory turnover for both years. (Round your answers to 1 decimal place.) 0-3. Compute the accounts receivable turnover for both years. (Round your answers to 1 decimal place.) b. Which of the following show a positive or negative trend? Year 2 Year 1 % 1 a- 2 a- 3 Gross profit percentage Inventory tumover Accounts receivable turnover times times times times Trend b. Gross profit rate Inventory turnover Accounts receivable turnover Growth in net sales
Step by Step Solution
There are 3 Steps involved in it

Get step-by-step solutions from verified subject matter experts