

Question: Selected financial information (in millions, except per-share information) is available for CIBC at October 31: 2018 2017 2015 $2,356 $2,121 $1,879 $5.32 $5.08 $4.75 $89
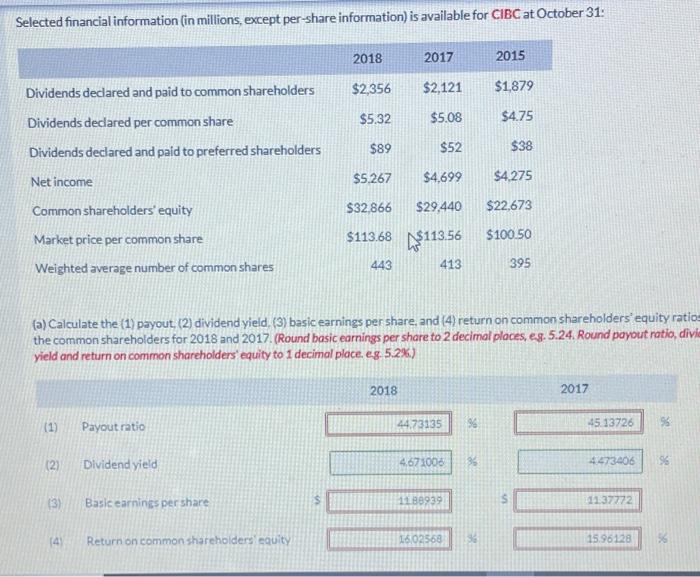
Selected financial information (in millions, except per-share information) is available for CIBC at October 31: 2018 2017 2015 $2,356 $2,121 $1,879 $5.32 $5.08 $4.75 $89 $52 $38 Dividends declared and paid to common shareholders Dividends declared per common share Dividends declared and paid to preferred shareholders Net income Common shareholders' equity Market price per common share Weighted average number of common shares $5,267 $4,699 $4,275 $32,866 $29,440 $22,673 $113.68 $100.50 ^$113.56 443 413 395 (a) Calculate the (1) payout. (2) dividend yield (3) basic earnings per share, and (4) return on common shareholders' equity ratio the common shareholders for 2018 and 2017. (Round basic earnings per share to 2 decimal places, eg: 5.24. Round payout ratio, divi yield and return on common shareholders' equity to 1 decimal place. eg. 5.2%) 2018 2017 (1) 96 44.73135 Payout ratio Se 45.13726 (2) Dividend yield 4.671006 33 4473406 13 Basic earnings per share 1180939 1137772 14 Return on common shareholders equity 1602568 15.96 128
Step by Step Solution
There are 3 Steps involved in it

Get step-by-step solutions from verified subject matter experts