

Question: Selected nancial data for Quick Sell, Inc., a retail store, appear as follows. Year 2 Year 1 Sales (all on account) S 794,000 $ 607,000
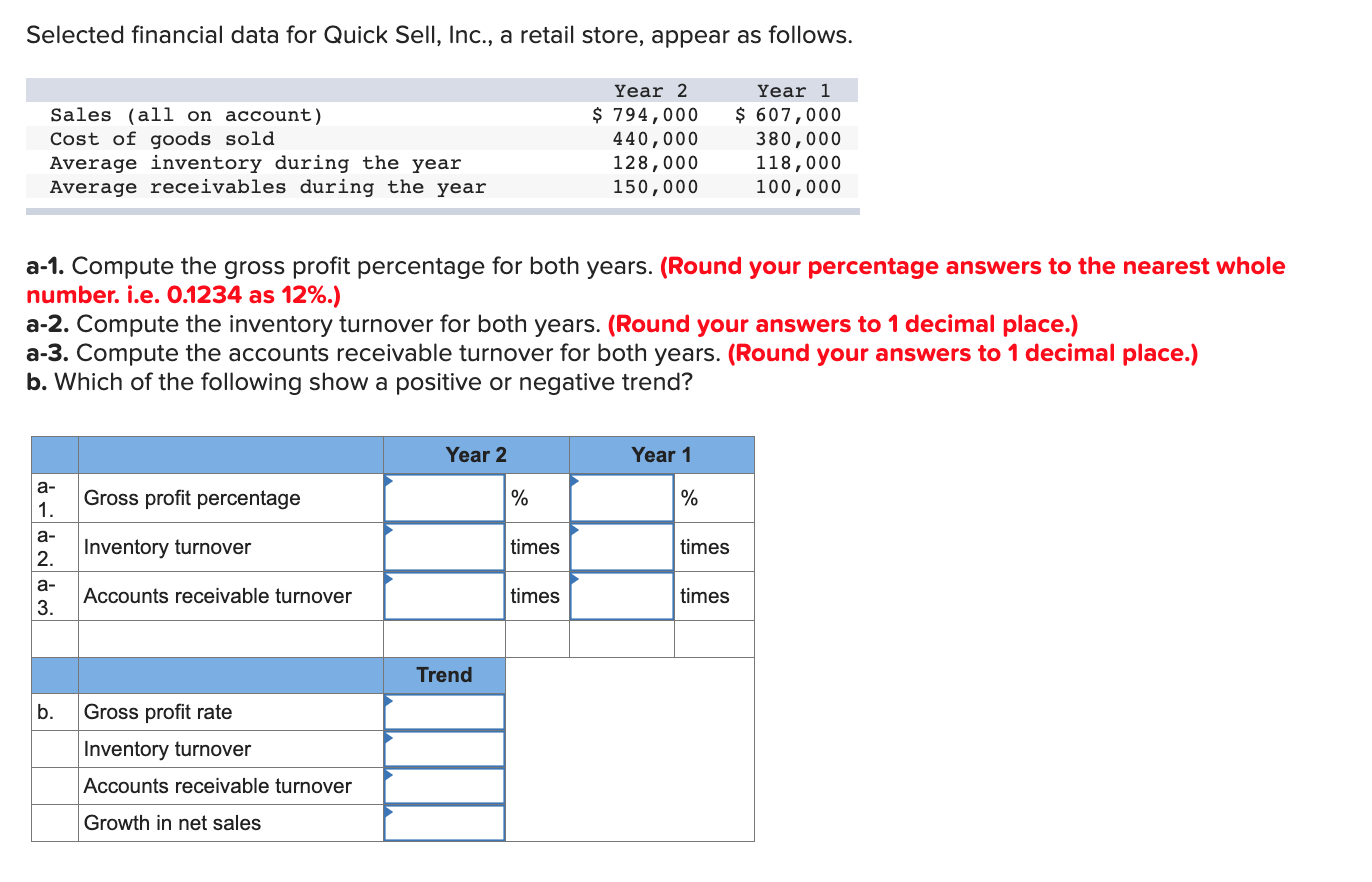
Selected nancial data for Quick Sell, Inc., a retail store, appear as follows. Year 2 Year 1 Sales (all on account) S 794,000 $ 607,000 Coat of goods sold 440,000 380,000 Average inventory during the year 123,000 113,000 Average receivables during the year 150,000 100,000 a-1. Compute the gross prot percentage for both years. (Round your percentage answers to the nearest whole number. i.e. 0.1234 as 12%.) a-2. Compute the inventory turnover for both years. (Round your answers to 1 decimal place.) a-3. Compute the accounts receivable turnover for both years. (Round your answers to 1 decimal place.) b. Which of the following show a positive or negative trend? Gross prot percentage Inventory turnover Accounts receivable turnover Gross prot rate Inventory turnover Accounts receivable turnover Growth in net sales
Step by Step Solution
There are 3 Steps involved in it

Get step-by-step solutions from verified subject matter experts