

Question: Self-Assessment 8. Which range would you select to create a pie chart of Product 1 sales for January through March? 9. 10. A B
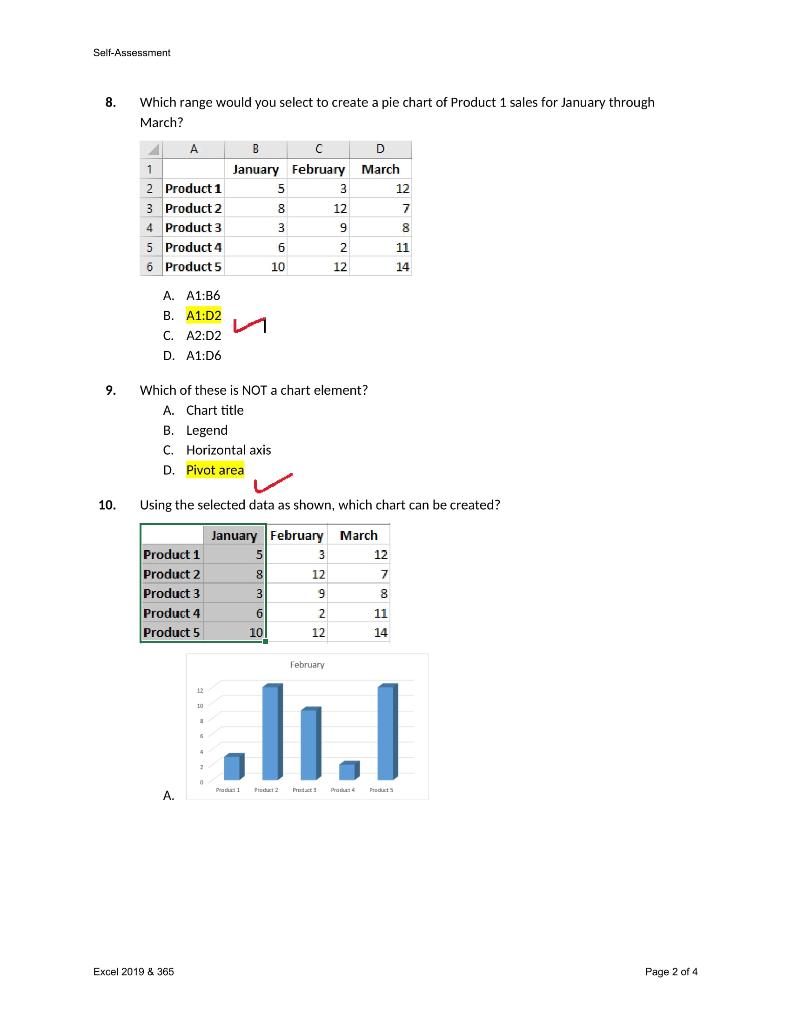
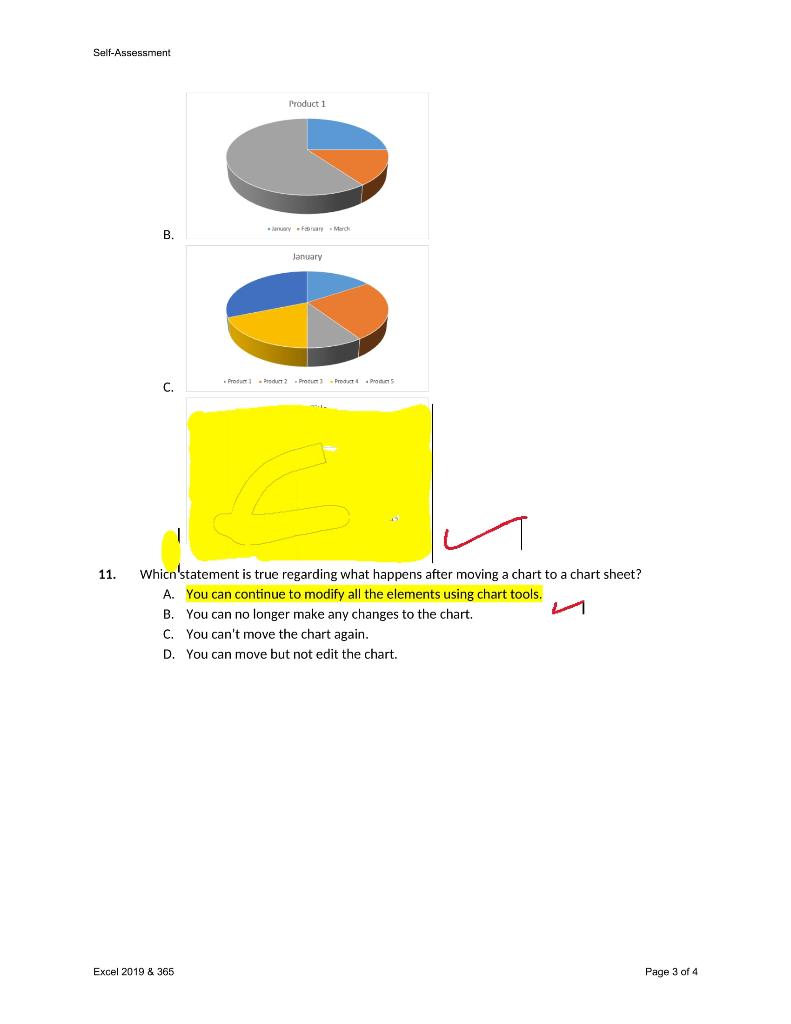
Self-Assessment 8. Which range would you select to create a pie chart of Product 1 sales for January through March? 9. 10. A B D 1 January February March 2 Product 1 5 3 12 3 Product 2 8 12 7 4 Product 3 3 9 8 5 Product 4 6 2 11 6 Product 5 10 12 14 A. A1:B6 B. A1:D2 C. A2:D2 D. A1:D6 Which of these is NOT a chart element? A. Chart title B. Legend C. Horizontal axis D. Pivot area Using the selected data as shown, which chart can be created? January February March Product 1 5 3 12 Product 2 8 12 7 Product 3 3 9 8 Product 4 6 2 11 Product 5 10 12 14 A. Excel 2019 & 365 February 12 10 a 4 2 .II.I Produ1 Product Product Product Product Page 2 of 4
Step by Step Solution
There are 3 Steps involved in it

Get step-by-step solutions from verified subject matter experts