

Question: Sep 9, 2021 1. Complete the given tables and use the data to draw histograms. Hand in your work at the end of the lesson
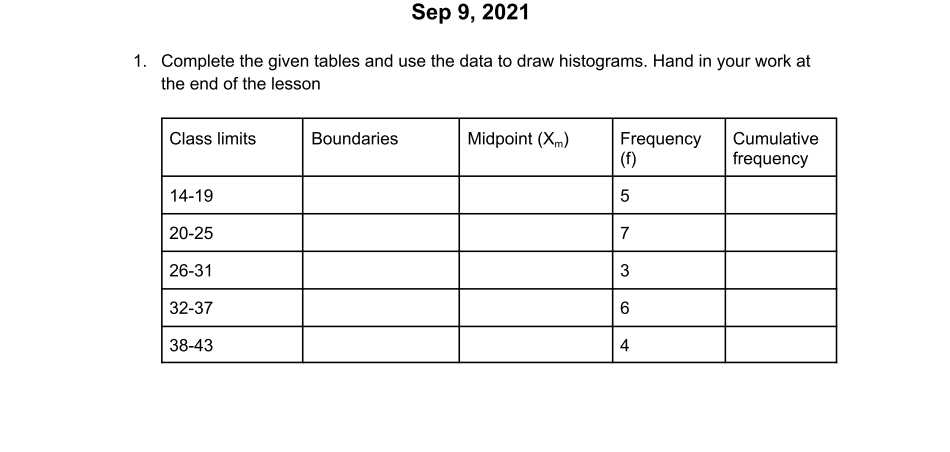
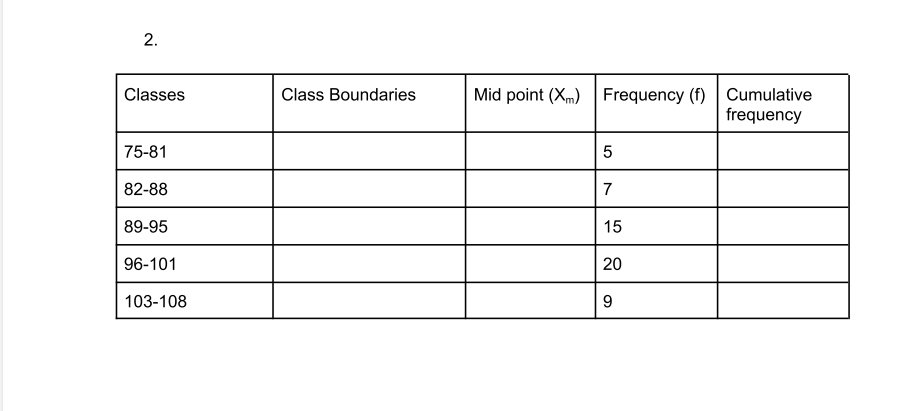
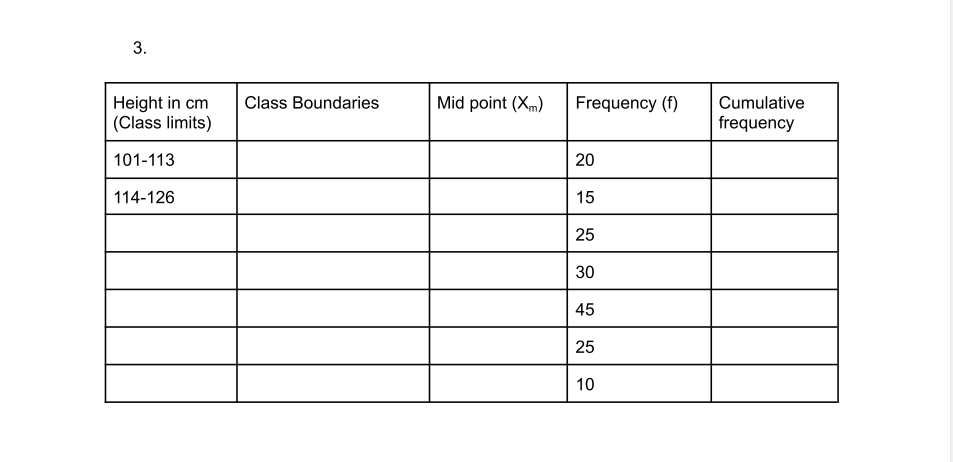
Sep 9, 2021 1. Complete the given tables and use the data to draw histograms. Hand in your work at the end of the lesson Class limits Boundaries Midpoint (Xm) Frequency Cumulative (f) frequency 14-19 5 20-25 7 26-31 3 32-37 6 38-43 42. Classes Class Boundaries Mid point (Xm) Frequency (f) Cumulative frequency 75-81 5 82-88 7 89-95 15 96-101 20 103-108 9Cumulative frequency Height in cm Class Boundaries (Class limits) Mid point (Km) Frequency {T} 101-113 M D 114-125 D} D M '31
Step by Step Solution
There are 3 Steps involved in it
1 Expert Approved Answer
Step: 1 Unlock

Question Has Been Solved by an Expert!
Get step-by-step solutions from verified subject matter experts
Step: 2 Unlock
Step: 3 Unlock