

Question: Separate analysis for each the Histogram and the pie chart. an extensive analysis of the results and include a copy and paste of the appropriate
Separate analysis for each the Histogram and the pie chart. an extensive analysis of the results and include a copy and paste of the appropriate visual display of the data into your document.
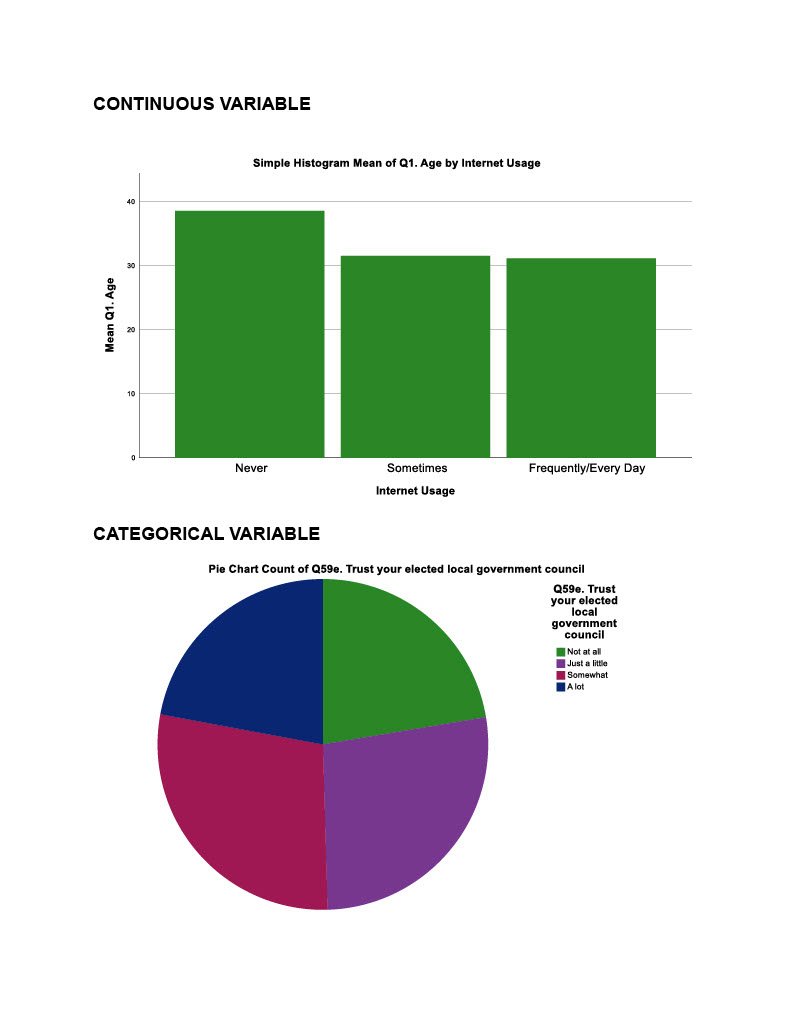
Based on the results of your data, provide a brief explanation of what the implications for social change might be.Early in your Assignment, when you relate which dataset you analyzed, please include the mean of the following variables. If you are using the Afrobarometer Dataset, report the mean of Q1 (Age).
Step by Step Solution
There are 3 Steps involved in it
1 Expert Approved Answer
Step: 1 Unlock

Question Has Been Solved by an Expert!
Get step-by-step solutions from verified subject matter experts
Step: 2 Unlock
Step: 3 Unlock