

Question: Separately do 2 year cross section analysis graph like below and findings/analysis for the 2 ratios of Beacon Pharma Cross Section Analysis: 0.66 0.65 Total
Separately do 2 year cross section analysis graph like below and findings/analysis for the 2 ratios of Beacon Pharma
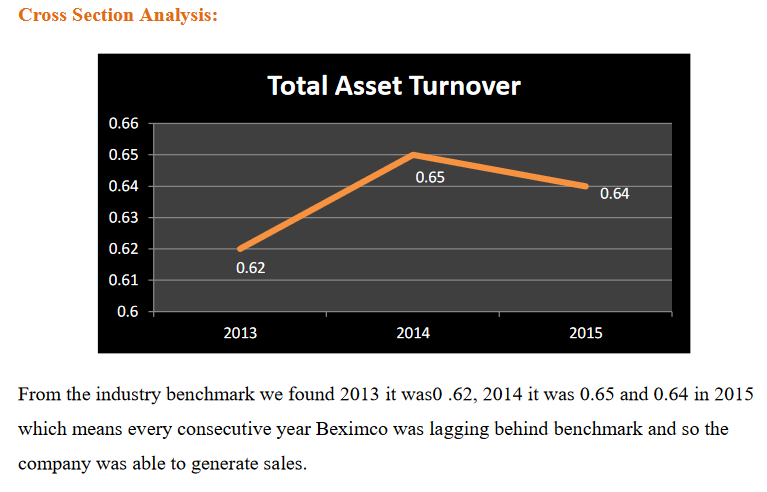
Cross Section Analysis: 0.66 0.65 Total Asset Turnover 0.64 0.63 0.62 0.62 0.61 0.6 2013 0.65 0.64 2014 2015 From the industry benchmark we found 2013 it was0 .62, 2014 it was 0.65 and 0.64 in 2015 which means every consecutive year Beximco was lagging behind benchmark and so the company was able to generate sales.
Step by Step Solution
There are 3 Steps involved in it
1 Expert Approved Answer
Step: 1 Unlock

Question Has Been Solved by an Expert!
Get step-by-step solutions from verified subject matter experts
Step: 2 Unlock
Step: 3 Unlock