

Question: separation During drying process for a wet solid, the decrease in free moisture content X, as a function of time t, is observed as shown
separation
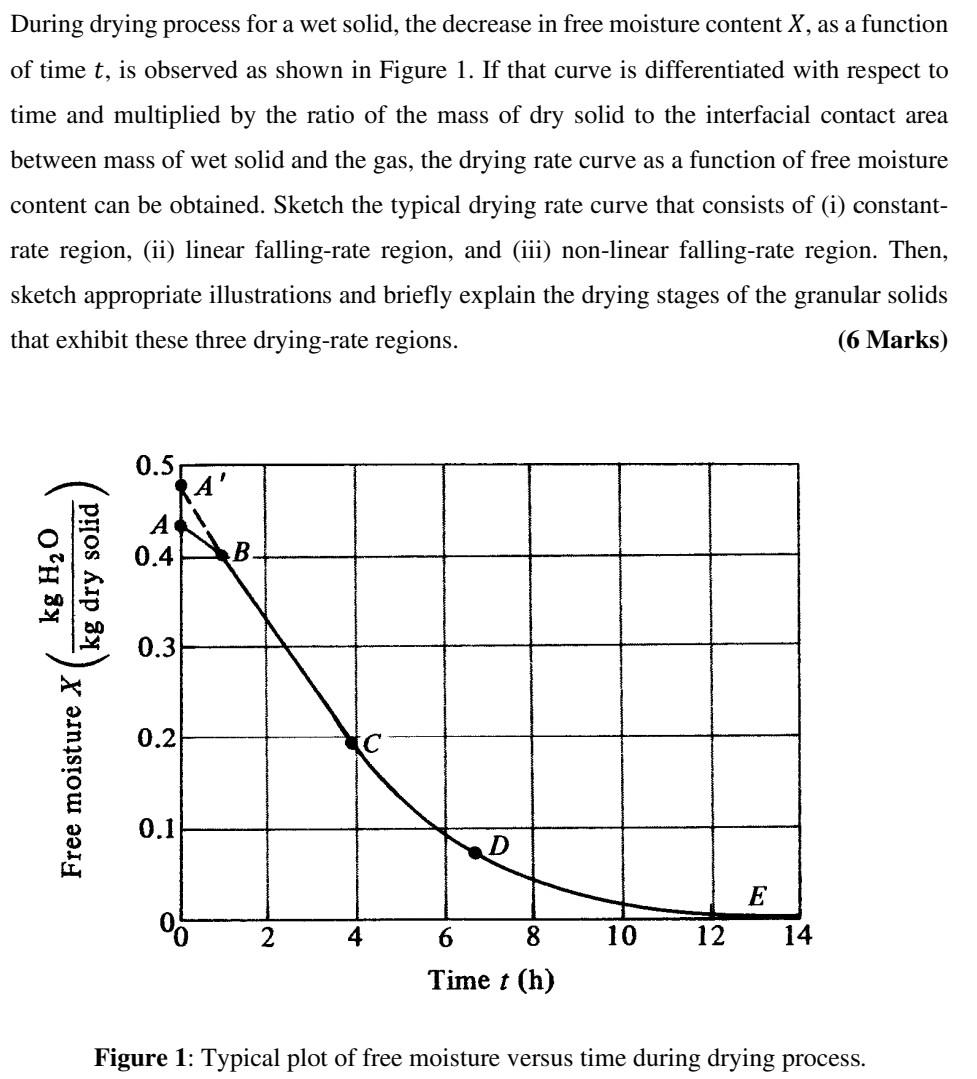
During drying process for a wet solid, the decrease in free moisture content X, as a function of time t, is observed as shown in Figure 1. If that curve is differentiated with respect to time and multiplied by the ratio of the mass of dry solid to the interfacial contact area between mass of wet solid and the gas, the drying rate curve as a function of free moisture content can be obtained. Sketch the typical drying rate curve that consists of (i) constant- rate region, (ii) linear falling-rate region, and (iii) non-linear falling-rate region. Then, sketch appropriate illustrations and briefly explain the drying stages of the granular solids that exhibit these three drying-rate regions. (6 Marks) 0.5 KA' AN 0.4 B 0.3 kg H20 kg dry solid Free moisture X 0.2 0.1 D E 06 2 4 10 12 14 6 8 Time t (h) Figure 1: Typical plot of free moisture versus time during drying process
Step by Step Solution
There are 3 Steps involved in it

Get step-by-step solutions from verified subject matter experts