

Question: . 1. Data is obtained from a batch drying experiment, with the weight monitored as a function of time, as shown in Table 1 below.
 .
.
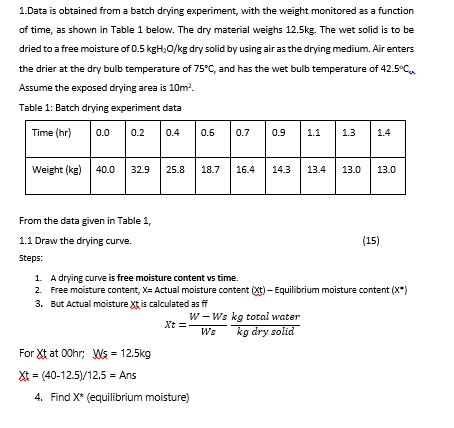
1. Data is obtained from a batch drying experiment, with the weight monitored as a function of time, as shown in Table 1 below. The dry material weighs 12.5kg. The wet solid is to be dried to a free moisture of 0.5 kgH O/kg dry solid by using air as the drying medium. Air enters the drier at the dry bulb temperature of 75C, and has the wet bulb temperature of 42.5C Assume the exposed drying area is 10m?. Table 1: Batch drying experiment data Time (hr) 0.0 0.2 0.4 0.6 0.7 0.9 1.1 1.3 1.4 Weight (kg) 40.0 32.9 25.8 18.7 16.4 14.3 13.4 13.0 13.0 From the data given in Table 1, 1.1 Draw the drying curve. (15) Steps: 1. A drying curve is free moisture content vs time. 2. Free moisture content, X-Actual moisture content (xt) - Equilibrium moisture content (**) 3. But Actual moisture xt is calculated as ff W-Ws kg total water Xt = Ws kg dry solid For Xt at Ohr: Ws = 12.5kg ; Xt = (40-12.5)/12.5 = Ans 4. Find X* (equilibrium moisture) =
Step by Step Solution
There are 3 Steps involved in it

Get step-by-step solutions from verified subject matter experts