

Question: September 21. ___ September 28 ____ October 5. ____ October 12 ____ The following table gives the number of pints of type A blood used
September 21. ___
September 28 ____
October 5. ____
October 12 ____
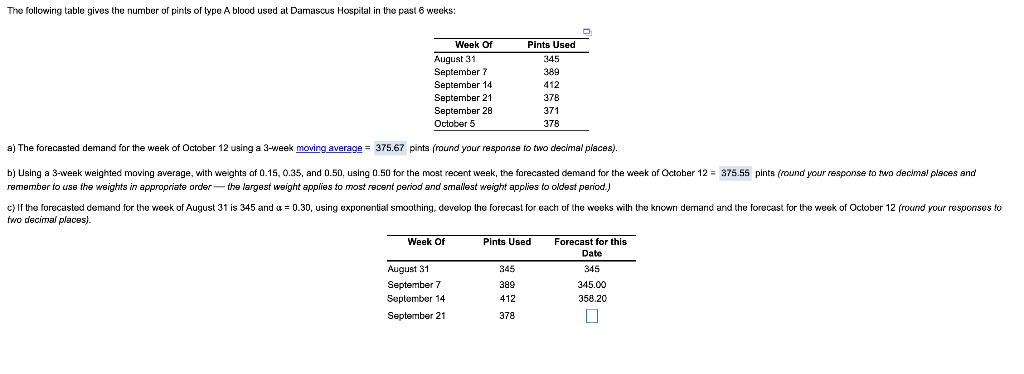
The following table gives the number of pints of type A blood used at Damascus Hospital in the past 6 weeks: Week of August 31 September 7 September 14 September 21 September 28 October 5 Pints Used 345 3.89 412 378 371 378 a) The forecasted demand for the week of October 12 using a 3-week moving average = 375.67 pints (round your response to two decimal places). b) Using a 3-week weighted moving average, with weights of 0.15, 0.35, and 0.50, using 0.50 for the most recent week, the forecasted demand for the week of October 12 = 375.5s pints (round your response to two decimal places and remember to use the weights in appropriate order the largest weight applies to most recent period and smallest weight applies to oldest period.) c) If the forecasted demand for the week of August 31 is 345 and 4 = 0.30, using exponential smoothing, develop the forecast for each of the weeks with the known demand and the forecast for the week of October 12 (round your responses to two decimal places). Week of Pints Used Forecast for this Date August 31 345 345 September 7 399 345.00 September 14 412 358.20 September 21 378Step by Step Solution
There are 3 Steps involved in it
1 Expert Approved Answer
Step: 1 Unlock

Question Has Been Solved by an Expert!
Get step-by-step solutions from verified subject matter experts
Step: 2 Unlock
Step: 3 Unlock