

Question: Set control limits for this process for the R-chart. UCLR=7.01 grams (round your response to two decimal places). LCLR=0 grams (round your response to two
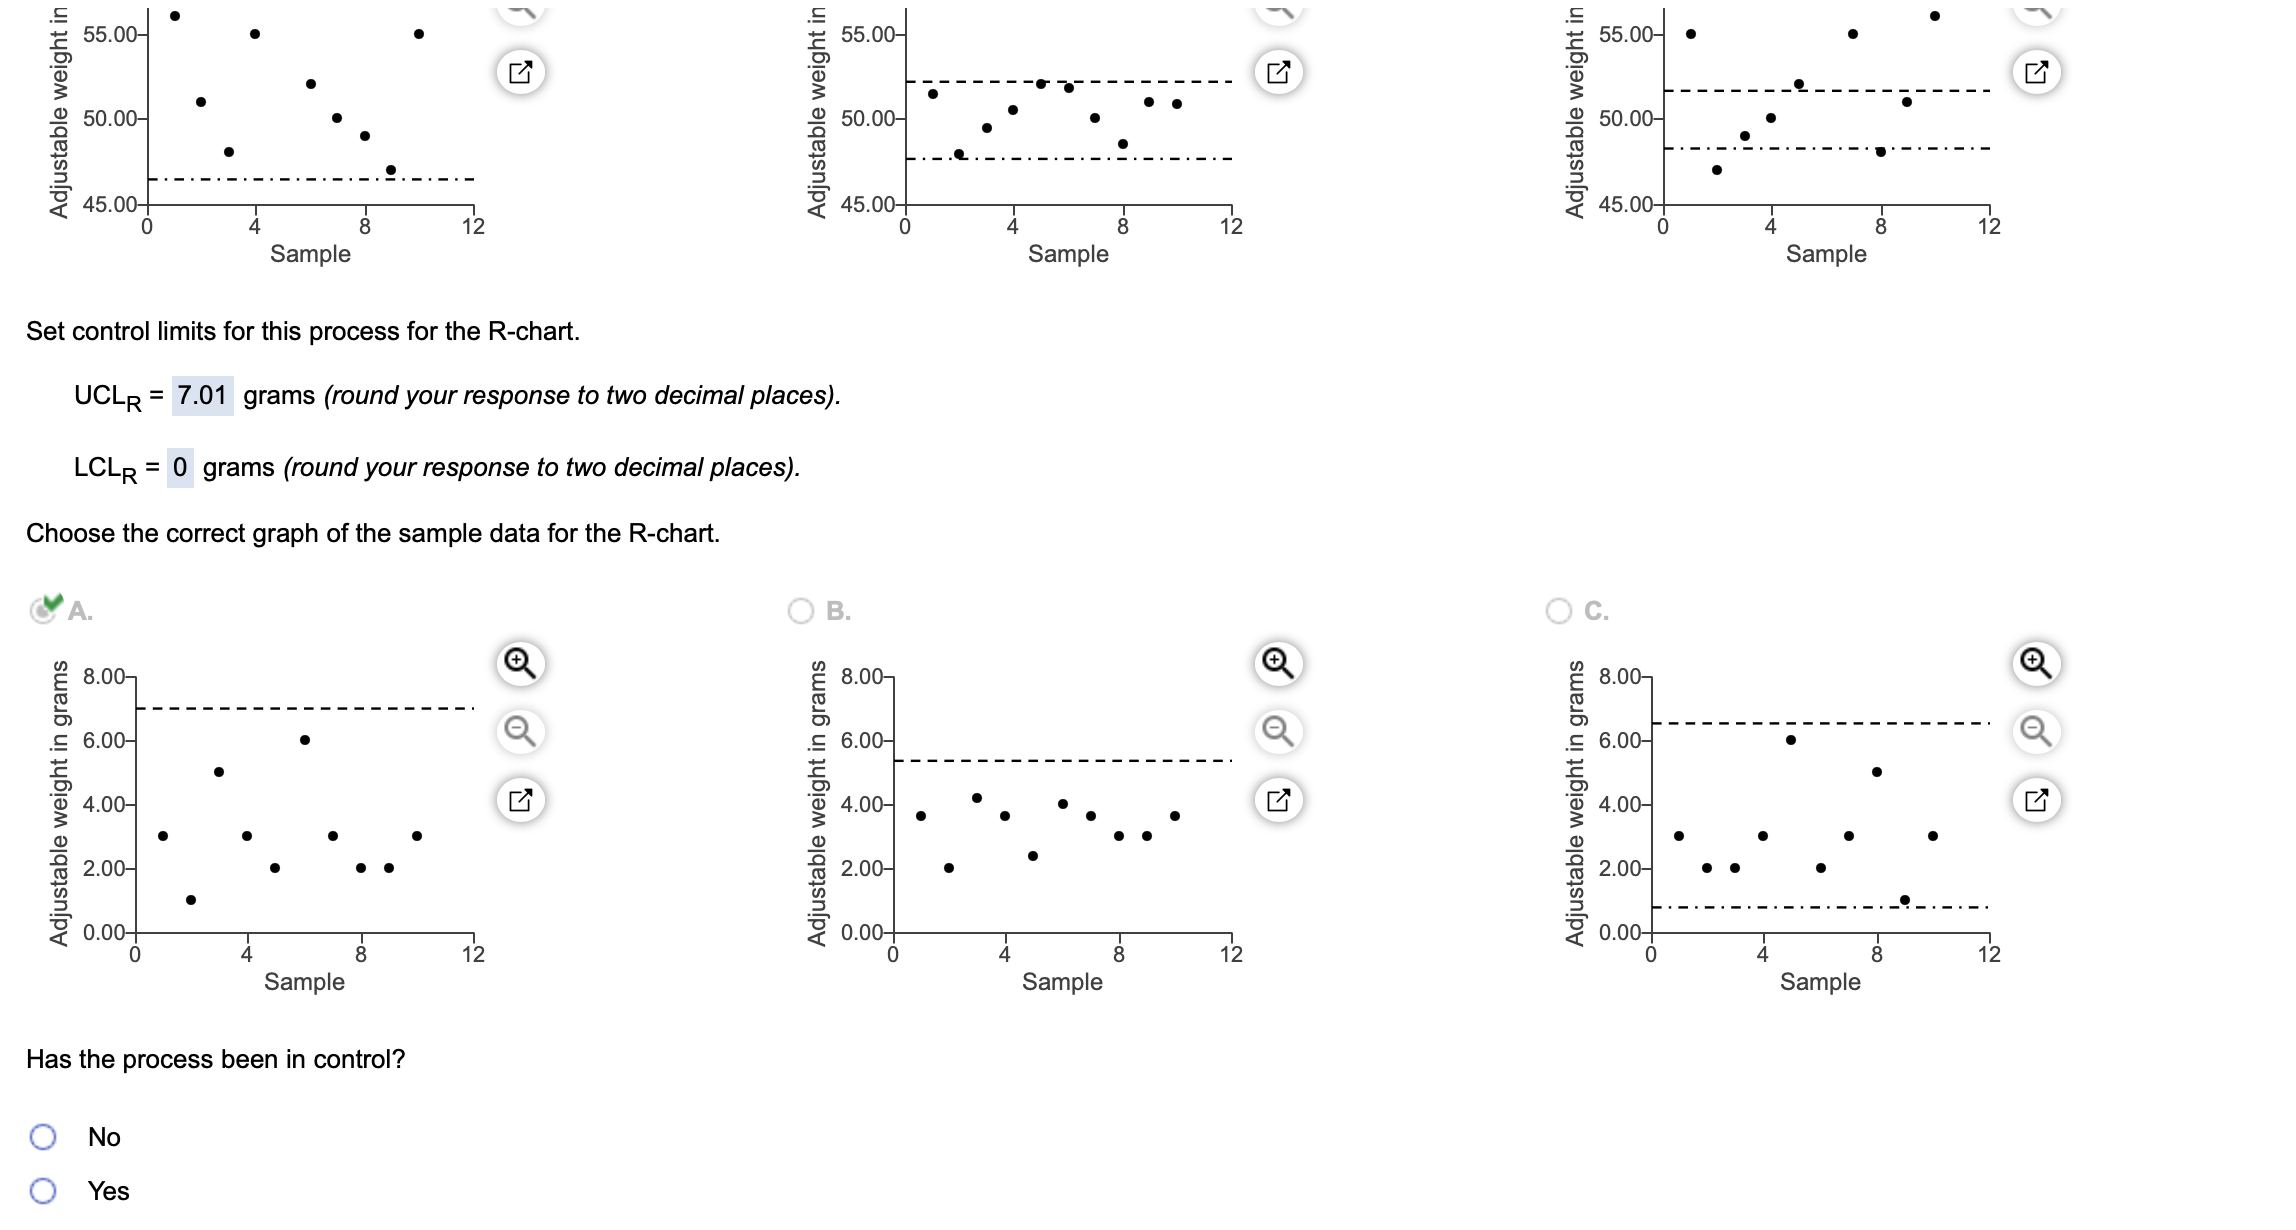
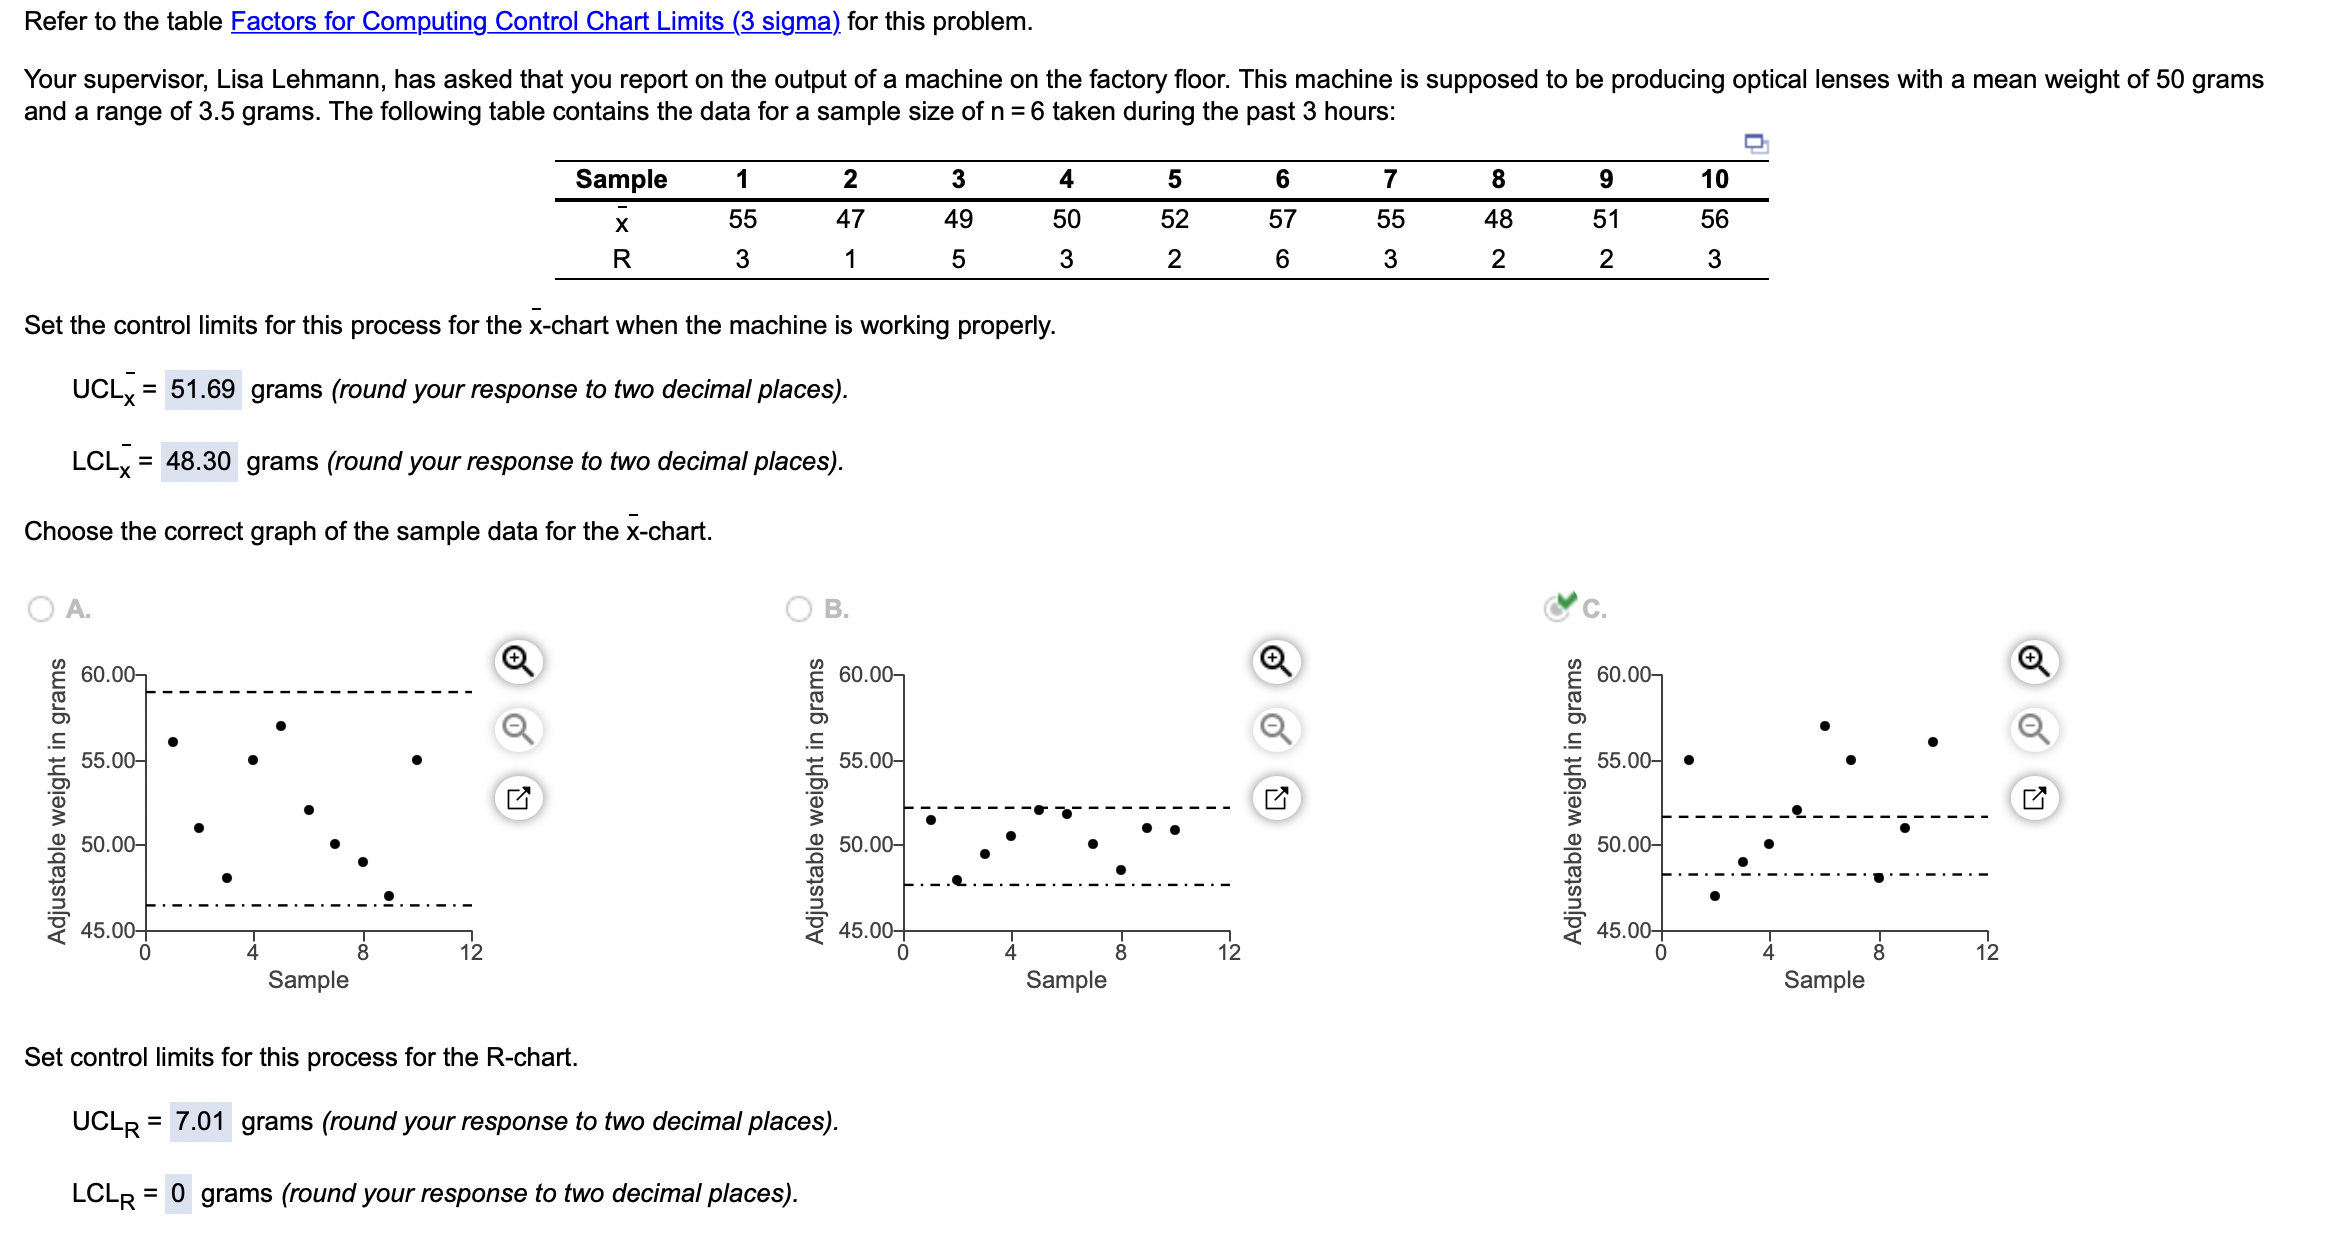
Set control limits for this process for the R-chart. UCLR=7.01 grams (round your response to two decimal places). LCLR=0 grams (round your response to two decimal places). Choose the correct graph of the sample data for the R-chart. i B. Has the process been in control? No Yes Refer to the table Factors for Computing Control Chart Limits (3 sigma) for this problem. and a range of 3.5 grams. The following table contains the data for a sample size of n=6 taken during the past 3 hours: Set the control limits for this process for the x-chart when the machine is working properly. UCLX=51.69grams(roundyourresponsetotwodecimalplaces).LCLx=grams(roundyourresponsetotwodecimalplaces). Choose the correct graph of the sample data for the x-chart. A. - Set control limits for this process for the R-chart. UCLR=7.01grams(roundyourresponsetotwodecimalplaces).LCLR=0grams(roundyourresponsetotwodecimalplaces).
Step by Step Solution
There are 3 Steps involved in it

Get step-by-step solutions from verified subject matter experts