

Question: Settle Chg Open Interest Contract Open High hilo Low Cotton (ICE-US)-50,000 lbs.: cents per lb. Dec 61.87 62.07 61.61 March 16 62.08 62.29 61.71 Orange
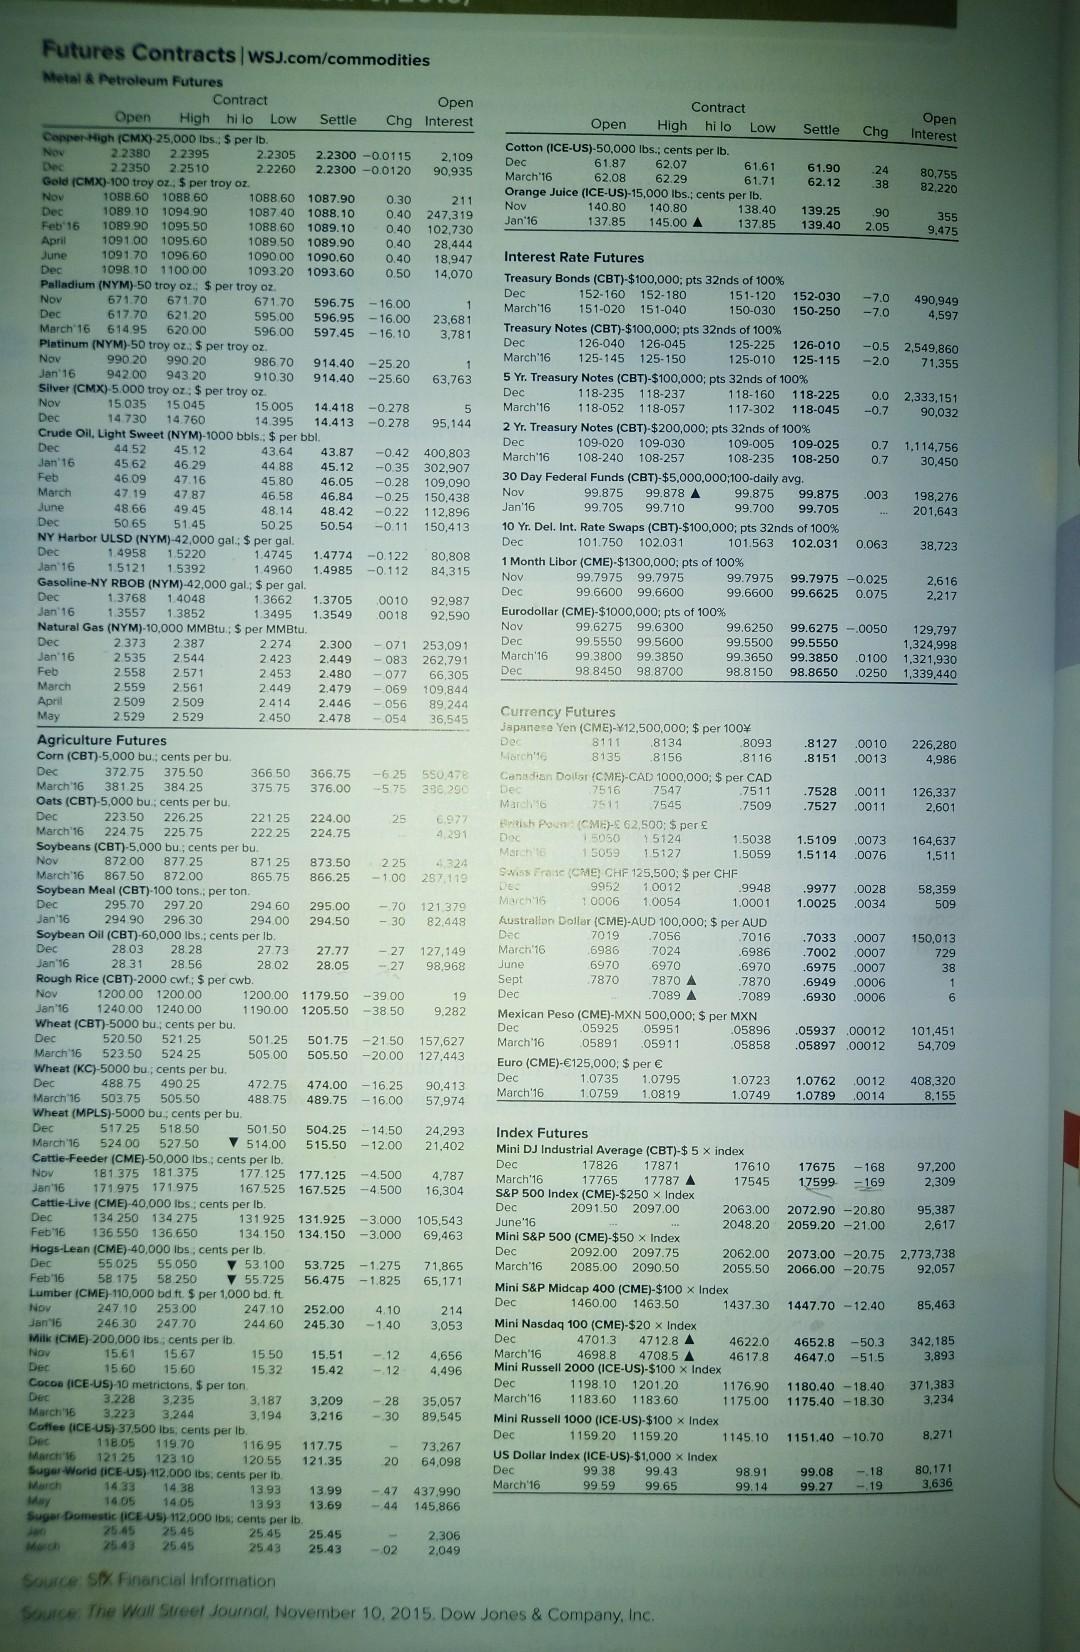
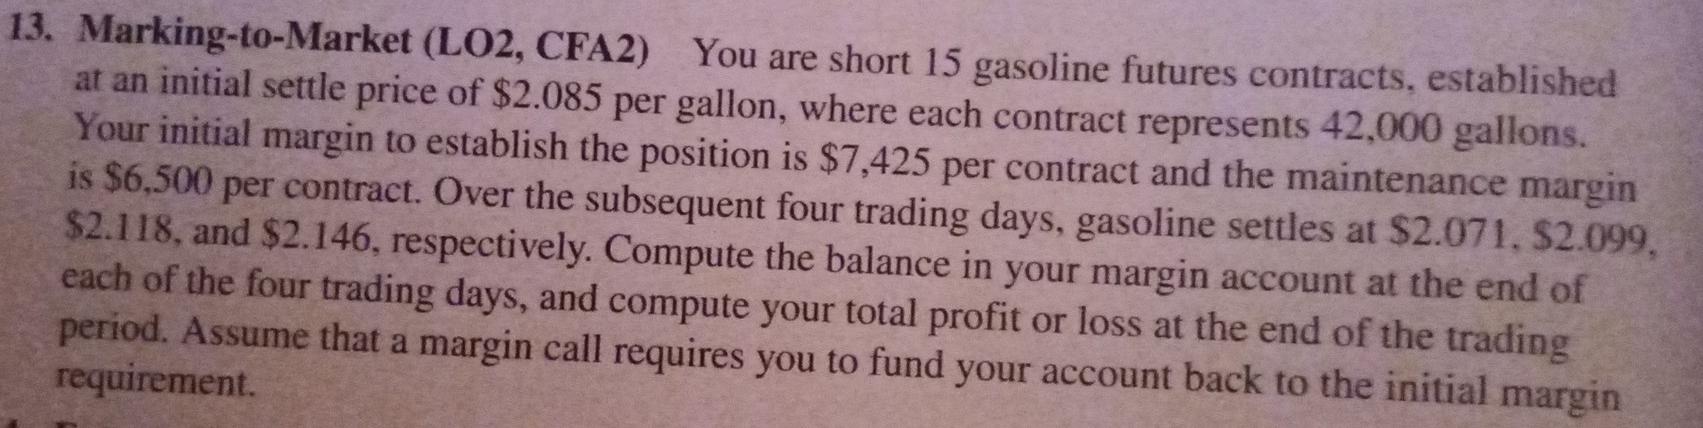
Settle Chg Open Interest Contract Open High hilo Low Cotton (ICE-US)-50,000 lbs.: cents per lb. Dec 61.87 62.07 61.61 March 16 62.08 62.29 61.71 Orange Juice (ICE-US)-15,000 lbs.: cents per lb. Nov 140.80 140.80 138.40 Jan'16 137.85 145.00 A 137.85 61.90 62.12 .24 .38 80,755 82.220 139.25 139.40 .90 2.05 355 9,475 943 20 118-045 108-257 Interest Rate Futures Treasury Bonds (CBT)-$100,000: pts 32nds of 100% Dec 152-160 152-180 151-120 152-030 -7.0 490,949 March '16 151-020 151-040 150-030 150-250 -7.0 4,597 Treasury Notes (CBT)-$100,000; pts 32nds of 100% Dec 126-040 126-045 125-225 126-010 -0.5 2,549,860 March '16 125-145 125-150 125-010 125-115 -2.0 71,355 5 Yr. Treasury Notes (CBT)-$100,000: pts 32nds of 100% Dec 118-235 118-237 118-160 118-225 0.0 2.333.151 March '16 118-052 118-057 117-302 -0.7 90.032 2 Yr. Treasury Notes (CBT)-$200,000; pts 32nds of 100% Dec 109-020 109-030 109-005 109-025 0.7 1.114.756 March '16 108-240 108-235 108-250 0.7 30,450 30 Day Federal Funds (CBT) $5,000,000;100-daily avg. Nov 99.875 99.878 A 99.875 99.875 .003 198,276 Jan'16 99.705 99.710 99.700 99.705 201,643 10 Yr. Del. Int. Rate Swaps (CBT)-$100,000; pts 32nds of 100% Dec 102.031 101.563 102.031 0.063 38.723 1 Month Libor (CME)-$1300,000; pts of 100% Nov 99.7975 99.7975 99.7975 99.7975 -0.025 2,616 Dec 99 6600 99.6600 99.6600 99.6625 0.075 2.217 Eurodollar (CME)-$1000,000; pts of 100% Nov 99.6275 99.6300 99.6250 99.6275-0050 129.797 Dec 99,5550 99.5600 99.5500 99.5550 1.324,998 March '16 99.3800 99.3850 99.3650 99.3850 .0100 1.321,930 Dec 98.8450 98.8700 98.8150 98.8650 0250 1,339,440 50.54 101.750 13768 1.3852 March .8127 .8151 0010 .0013 226,280 4,986 7516 Futures Contracts | WSJ.com/commodities Metal & Petroleum Futures Contract Open Open High hilo Low Settle Chg Interest Copper High (CMX) 25,000 lbs.: $ per lb. Now 2.2380 22395 2.2305 2.2300 -0.0115 2.109 Dec 22350 2.2510 22260 2.2300 -0.0120 90,935 Gold (CMX)-100 troy oz. $ per troy oz. Nov 105B 60 1088,60 1088,60 1087.90 0.30 211 Dec 1089.10 1094.90 1087.40 1088.10 0.40 247,319 Feb 15 1089 90 1095 50 10BB 60 1089.10 0.40 102,730 April 109100 1095.60 1089.50 1089.90 0.40 28,444 June 1091.70 1096 60 1090.00 1090.60 0.40 18,947 Dec 1098.10 1100 00 1093.20 1093.60 0.50 14.070 Palladium (NYM)-50 troy oz. $ per troy oz. Nov 671.70 671 70 67170 596.75 -16.00 Dec 617.70 621 20 595.00 596.95 - 16.00 23,681 March 16 614.95 620.00 596.00 597.45 -16.10 3,781 Platinum (NYM)-50 troy oz. $ per troy oz. Nov 990 20 990,20 986 70 914.40 -25 20 1 Jan 16 942.00 910.30 914.40 -25.60 63,763 Silver (CMX)-5.000 troy oz. $ per troy oz. Nov 15.035 15 045 15 005 14.418 -0.278 5 Dec 14 730 14.760 14.395 14.413 -0.278 95,144 Crude Oil, Light Sweet (NYM)-1000 bbls., $ per bbl. Dec 44.52 45.12 43.64 43.87 -0.42 400,803 Jan 16 45.62 46.29 44 88 45.12 -0.35 302,907 Feb 46.09 47.16 45.80 46.05 -0.28 109,090 March 47.19 47 87 46.58 46.84 -0.25 150,438 June 48.66 49.45 48.14 48.42 -0.22 112.896 Dec 50 65 51.45 50.25 -0.11 150,413 NY Harbor ULSD (NYM) 42,000 gal: $ per gal. Dec 1.4958 1.5220 1.4745 1.4774 -0.122 80,808 Jan 16 1.5121 1.5392 14960 1.4985 -0.112 84.315 Gasoline NY RBOB (NYM)-42.000 gal: $ per gal. Dec 1 4048 1 3662 1.3705 0010 92.987 Jan 16 1.3557 13495 1.3549 0018 92,590 Natural Gas (NYM)-10,000 MMBtu: $ per MMBtu. Dec 2 373 2.387 2274 2.300 -071 253,091 Jan 16 2.535 2544 2423 2.449 083 262.791 Feb 2558 2571 2.453 2.480 - 072 66,305 2559 2.561 2.449 2.479 069 109,844 April 2509 2509 2414 2.446 056 99,244 May 2.529 2529 2.450 2.478 - 054 36,545 Agriculture Futures Corn (CBT)-5,000 bu: cents per bu Dec 372.75 375.50 366.50 366.75 -6.25 550,47 March '16 381.25 384.25 375 75 376.00 -575 306 29 Oats (CBT)-5,000 bu, cents per bu Dec 223.50 226.25 22125 224.00 25 6.977 March '16 224.75 225.75 222 25 224.75 Soybeans (CBT)-5.000 bu, cents per bu. Nov 87200 877.25 87125 873.50 225 4.324 March '16 867.50 872.00 865.75 866.25 - 100 287119 Soybean Meal (CBT)-100 tons. per ton. Dec 295 70 297 20 294 60 295.00 - 70 121 379 Jan 16 29490 294.00 294.50 - 30 82 449 Soybean Oil (CBT)-60,000 lbs, cents per lb Dec 28.03 28.28 2773 27.77 - 27 127,149 Jan'16 28 31 28.56 28.02 28.05 - 27 98.968 Rough Rice (CBT)-2000 cwf; $ per cwb. Nov 1200.00 1200.00 1200.00 1179.50 -39.00 19 Jan'16 124000 1240 00 1190.00 1205.50 -38.50 9.282 Wheat (CBT)-5000 bu, cents per bu. Dec 520.50 52125 50125 501.75 -2150 157,627 March '16 523.50 524 25 505.00 505.50 --20.00 127.443 Wheat (KC)-5000 bu, cents per bu. Dec 488.75 490 25 472.75 474.00 -16.25 90,413 March 16 503.75 505.50 488.75 489.75 -16.00 57,974 Wheat (MPLS)-5000 bu, cents per bu. Dec 517 25 518 50 501.50 504.25 -14.50 24.293 March '16 524.00 52750 514.00 515.50 - 12.00 21.402 Cattle-Feeder (CME)-50,000 lbs, cents per lb. NOV 181 375 181 375 177.125 177.125 -4.500 4,787 Jan'16 171.975 171.975 167 525 167.525 -4.500 16,304 Cettle-Live (CME) 40,000 lbs., cents per lb. Dec 134 250 134 275 131925 131.925 -3.000 105,543 Feb'16 136 550 136,650 134. 150 134.150 -3.000 69,463 Hogs-Lean (CME) 40,000 lbs, cents per lb. Dec 55 025 55050 53.100 53.725 -1.275 71.865 Feb '16 58 175 58 250 55.725 56.475 -1.825 65,171 Lumber (CME)-110,000 bd ft. $ per 1,000 bd. ft Nov 247.10 253.00 247 10 252.00 4.10 214 Jan'16 247.70 244 60 245.30 -1.40 3,053 Milk CME)-200,000 ibs, cents per lb Nov 15.61 1567 15 50 15.51 - 12 4,656 Der 15.60 15.60 15.32 15.42 -12 4,496 Cocos (ICE-US)-10 metrictons, $ per ton Det 3.228 3.235 3.187 3,209 - 28 35,057 March '16 3.223 3.244 3,194 3,216 - 30 89,545 Coffee (ICE-U5) 37.500 lbs, cents per lb. Dac 118.05 116 95 117.75 73.267 March '16 121.25 123 10 120.55 121.35 20 64,098 Sugar World (CE-US) 112.000 lbs, cents per i March 14 33 14 38 13.93 13.99 - 47 437.990 14.05 1393 13.69 - 44 145.866 Sugar Domestic ICE-US) 12,000 lbs, cents per ib. 25.45 25.45 25 45 25.45 2,306 25.45 25.43 25.43 -02 2,049 7542 .7528 .7527 7509 .0011 .0011 7511 126,337 2,601 1.5109 1.5114 .0073 .0076 164,637 1,511 .9977 0028 Currency Futures Japanese Yen (CME)-12,500,000: $ per 100 De 8111 8134 8093 hurch'io 8135 8156 8116 Cendan Dollar (CME)-CAD 1000,000; $ per CAD be .7511 March 16 7545 Fish Poun (CME- 62,500: $ per Doc 5050 15124 1.5038 March 15059 15127 1.5059 Sx Franc (CME) CHF 125,500: $ per CHF 9952 1.0012 9948 March 16 1 0006 1.0054 1.0001 Australian Dollar (CME)-AUD 100,000; $ per AUD Dec 7019 .7056 7016 6986 7024 June 6970 6970 .6970 Sept 7870 7870 A .7870 Dec .7089 A .7089 Mexican Peso (CME)-MXN 500,000: $ per MXN Dec 05925 05951 .05896 .05891 05911 05858 Euro (CME)-125.000, $ per Dec 1.0735 1.0795 1.0723 March 16 1.0759 1.0819 1.0749 1.0025 58,359 509 .0034 296.30 March '16 6986 .7033 .7002 .6975 .6949 .6930 .0007 0007 .0007 .0006 .0006 150,013 729 38 1 6 March '16 .05937 00012 .05897 00012 101,451 54.709 0012 1.0762 1.0789 408,320 8.155 .0014 17675 -168 17599 - 169 97,200 2.309 2072.90 -20.80 2059.20 -21.00 95,387 2.617 2073.00 -20.75 2066.00 -20.75 2,773.738 92,057 Index Futures Mini DJ Industrial Average (CBT)-$5 x index Dec 17826 17871 17610 March '16 17765 17787 A 17545 S&P 500 Index (CME)-$250 x Index Dec 2091.50 2097.00 2063.00 June 16 2048.20 Mini S&P 500 (CME)-$50 x Index Dec 2092.00 2097.75 2062.00 March '16 2085.00 2090.50 2055.50 Mini S&P Midcap 400 (CME)-$100 x Index Dec 1460.00 1463.50 1437.30 Mini Nasdaq 100 (CME)-$20 x Index Dec 4701.3 4712.8 A 4622.0 March 16 4698.8 4708.5 A 4617.8 Mini Russell 2000 (ICE-US)-$100 x Index Dec 1198.10 1201.20 1176.90 1183.60 1183.60 1175.00 Mini Russell 1000 (ICE-US)-$100 x Index Dec 1159.20 1145.10 US Dollar Index (ICE-US)-$1,000 x Index Dec 99 38 99.43 98.91 March '16 99.59 99.65 99.14 1447.70 -12.40 85,463 246 30 4652.8 4647.0 -50.3 -51.5 342,185 3.893 March '16 1180.40 -18.40 1175.40-18.30 371,383 3,234 1159 20 8.271 119.70 1151.40 -10.70 99.08 99.27 - 18 -19 80,171 3,636 14.05 Source SX Financial Information Source The Wall Street Journal, November 10, 2015. Dow Jones & Company, Inc. 13. Marking-to-Market (LO2, CFA2) You are short 15 gasoline futures contracts, established at an initial settle price of $2.085 per gallon, where each contract represents 42,000 gallons. Your initial margin to establish the position is $7,425 per contract and the maintenance margin is $6,500 per contract. Over the subsequent four trading days, gasoline settles at $2.071, S2.099, $2.118, and $2.146, respectively. Compute the balance in your margin account at the end of each of the four trading days, and compute your total profit or loss at the end of the trading period. Assume that a margin call requires you to fund your account back to the initial margin requirement
Step by Step Solution
There are 3 Steps involved in it
1 Expert Approved Answer
Step: 1 Unlock

Question Has Been Solved by an Expert!
Get step-by-step solutions from verified subject matter experts
Step: 2 Unlock
Step: 3 Unlock