

Question: Settle Open Interest Chg Contract Open High hilo Low Cotton ICE-US) 50,000 ID: consperit May 7818 78.35 77.32 July 7873 78.84 78.09 Orange Juice ICE-US)-15.000
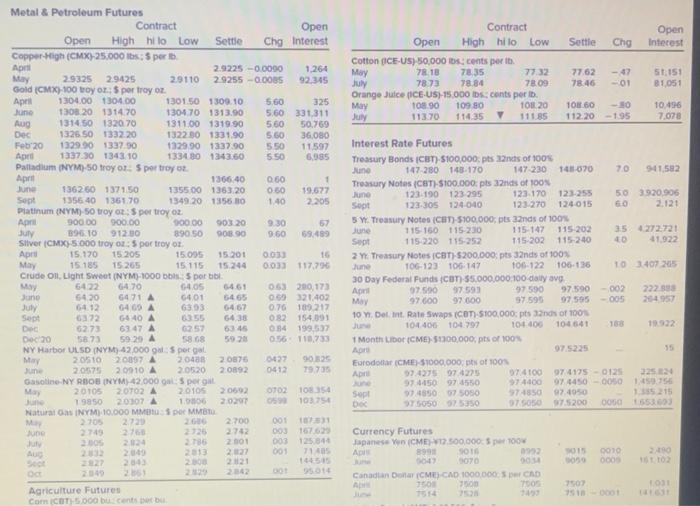
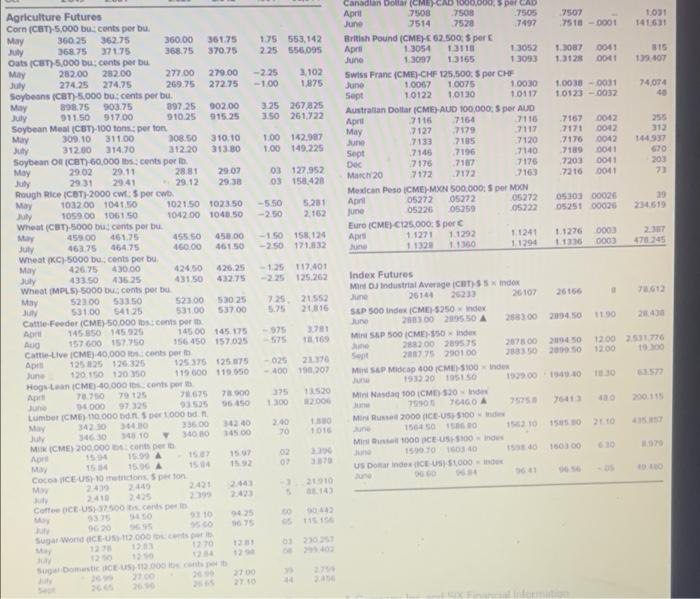
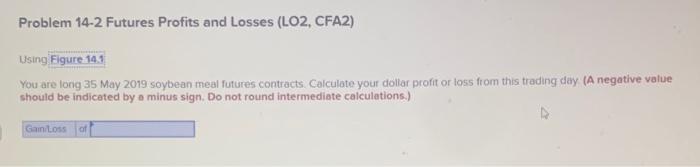
Settle Open Interest Chg Contract Open High hilo Low Cotton ICE-US) 50,000 ID: consperit May 7818 78.35 77.32 July 7873 78.84 78.09 Orange Juice ICE-US)-15.000 lbs. cont perib. May 108 90 109 80 10120 July 113.70 114.35 111.85 77.62 78.46 -47 -01 51.151 B1 051 108 60 112.20 -30 -195 10.496 7.078 Metal & Petroleum Futures Contract Open Open High hilo Low Settle C triterest Copper High (CMX) 25.000 16:5 pers. April 2.9225 -0.0090 1,264 May 2.9325 2.9425 2.9110 29255 -0.0005 92.345 Gold (CMX) 100 voyon: por troy on April 1304.001304.00 1301.50 1300 10 5.60 325 June 1308.201314.70 1304 70 1313.90 5.60 331,311 AUD 131450132070 1311.00 1319.90 560 50.769 Dec 1325 50 1332.20 1322 30 1331.90 5.60 36,080 Feb 20 1329 901337.90 1329.90 1337.00 5.50 11.597 Apre 133730 1343.10 133480 1343.60 5.50 6,985 Palladium (NYM)-50 troy os portray April 1366.40 060 1 June 136260137150 1355.00 1363.20 0.50 19,677 Sept 1356401361 70 1349.20135.0 1.40 2.205 Platinum (NYM) 50 troy 2: per troy April 900 DO 900.00 900.00 50 20 9.30 57 July 396 10 91230 890.50 903 90 9.60 69.49 Silver (CMX 5.000 troy On: por troy or April 15.770 15205 15.095 15.201 0.033 16 May 15.185 15.265 15 115 15.244 0033 117.796 Crude Oil, Light Sweet (NYM)-1000 b por ti M 64.22 64.70 6405 5461 063200173 June 5420 G471 A 6401 5465 0.69 21.402 July 64.12 6409A 6393 5467 0.76 189217 sept 0322 6440 A 64.33 082154 091 Dec 6273 63 47 A 6345 0.84 199 537 Dec 20 5873 59 29 A 58.68 056110.733 NY Harbor ULSD (NYM) 42.000 ga 5 pergal Me 20510 20807 2.048 20876 0427 9032 20575 20910 A 20520 20892 0412 19.705 Gasoline NY RBOB (NYM) 42.000 gals pergat May 2010 2002 A 20105 20692 0702 103 354 19850 20307 A 1.000 20297 103 Natural Gas NYM 10.000 MM Spor MM 2705 2.720 2.700 00 11 2749 2760 274 Do 200 2001 DO 125.840 2009 2013 001 7140 2 200 221 253 234 Agriculture Futures Com(CAT) 5.000 bucent Interest Rate Futures Treasury Bonds CBT) $100,000, pts 2nds of 100% June 147280 148-170 147230 4070 70 941.582 Treasury Notes (CBT)-5100.000: pts 3ds of 100% June 123.190 123 295 123.170 123255 50 3920 906 Sopt 123305124040 123270 124.015 GO 2.121 5 Y. Treasury Notes (CBT) $100.000, pts ands of 100% June 115 160 115-230 115-147 115-202 354272.721 Sept 115.220 115-252 115-202 115-240 40 41.922 27. Treasury Notes CBT)-5200,000 ps 32nds of 100% June 106-123106147 106-122 106-136 103407205 30 Day Federal Funds CBT) 55.000.000:100 day avg April 97590 97 593 97 590 97.590 002 2228 May 97.600 97.000 97.595 97.555 005 204957 10 Y Delint. Rate Swaps (COT)-5100.000pts 32 of 100 104.406 104797 104.400 10-4 541 188 1922 1 Month Libor (CME) 51100.000, pts of 100 Apru 97.5225 35 Eurodo CME)-51000,000 of 100% ADI 074275 074225 14100 9741750125 325 97 4450974550 74400 97 4450 - 0000 10 Sept 97435057 5050 974850 97.4950 T15215 Dec 750507 5350 97 5050 7.5200 0000 1553 JU 22 015 2 Currency Futures Japanese WCME17.500.000 51004 ADHE 599 SO 3070 Canadian Dollar CME) CAD 1000000 CAD A TO 7500 700 0010 000 TO 7502 7507 7518-0001 1031 141631 1.75 553,142 225 556.095 1. 1087 1.3128 0041 0041 315 139407 -2.25 -100 3,102 1875 74.074 1.0038 - 0031 1.0123 - 0032 May 3.25 267825 3.50 261.722 Canadian Dollar (CME) CAD 1000.000 per CAD April .7108 7508 7505 June 7514 7528 7497 British Pound (CMEHE 62.500, 5 per April 13054 13118 13052 June 1.3097 1.3165 13093 Swiss Franc (CME-CHF 125.500.5 per CHF June 10067 1.0075 10030 Sept 10122 1.0130 10117 Australian Dollar (CME) AUD 100,000 $ por AUD April 7116 7164 7116 May 7127 7179 7117 June 7133 7185 7120 Sept 7145 7196 7140 Dec 7176 7187 7175 Man 20 7172 7172 7163 Mexican Peso CME-MXN 500.000 per MOON April 05272 05272 05272 June 05226 05250 05222 Euro (CME) C125.000: 5 perc Apr 1.1271 11292 11241 June 1130 11294 1.00 142,907 1.00 149.225 7167 7171 7176 7189 7203 7216 0042 0042 0042 0041 0041 312 144937 690 203 73 03 127,952 03158 428 0001 -5.50 -2.50 5281 2.162 0530300026 05251 00026 Agriculture Futures Corn (CBT) 5,000 bucents per bu. May 36025 362.75 360.00 361.75 July 368.75 37175 368.75 370.75 Oats (CBT) 5,000 bucents per bu May 282.00 282.00 277.00 279.00 July 274.25 274.75 269.75 272.75 Soybeans (CBT)-5.000 bucents per bu 898.75 903.75 397.25 902.00 July 911.50 91700 910.25 915.25 Soybean Meal (CBT)-100 tons perton May 309.10 311.00 308.50 310.10 July 31200 314.70 31220 313.30 Soybean OL (CBT) 60,000 lbs. cents per in May 29.02 29.11 2881 29.07 aby 2931 29.12 29.38 Rough Rice ICBT)-2000 cw: 5 per cwb May 1032001041.50 1021.50 1023.50 July 105900 106150 1042.00 1040 50 Wheat (CBT) 5000 cents portu My 459.00 461.75 455 50 450.00 July 46275 454.75 160.00 46150 Wheat Kc) 5000 bucents per bu May 426.75 430.00 424 50 426.25 July 133 50 436.25 431.50 432.75 Wheat (MPL) 5000 cont petu May 52300 533.50 52300 530 25 $31.00 54125 53100 53700 Cattle-Feeder (CME) 50.000 lbscents port Art 145 950 45 925 14500 145 175 AO 157600 157750 156450 157025 Cattle-Live CME) 40,000 cents per Apr 125 125 26.325 125 375 125 075 Jun 120 150 1200 119 600 119.950 Hogean CME) 40.000 cents port Art 7750 792 7675 7 000 14.000 97 125 56450 Lumber CM) 110.000 de tot 34210 JUN 340 34 10 340 10 MCME) 200.000 con petit 19 234.619 ISO 158.124 -2.50 171.32 1.1276 1336 0003 000 470245 -1.25 117401 125.262 73612 21552 2016 11.90 2040 -975 3701 TB169 1200 2.531.776 1200 19 025 21176 - 400 190.207 Index Futures MI DJ Industrial Average CBT) 55 x Indo June 26144 20233 26107 26166 S&P 500 Index CMD-5250 index une 2003 00289550 A 258300 205450 Min SAP 500 CME) $50 22.00 289575 207800 200450 2007 75230100 2000 MUSEP Mp 400 CMES100 1933 20 1951 192900 Mint a 100 CME) 520 705 YAGOA Minu 2000 (ICE-U55100 1564000 M100 CEUS100 1500 TO 16000 150100 US Doar in ICEUSSL000 18 30 1300 2000 21 200 70 101 AD OP M Coco CEUS)0 metros. Specto M 2430 2440 21 910 14 CoffCE.US500 cents 10 56 1151 20 Sugar Word OCE-US). 12 000 133035 Some CES)-1122000 2 Problem 14-2 Futures Profits and Losses (LO2, CFA2) Using Figure 14.1 You are long 35 May 2019 soybean meal futures contracts. Calculate your dollar profit or loss from this trading day (A negative value should be indicated by a minus sign. Do not round intermediate calculations.) Gain Loss of
Step by Step Solution
There are 3 Steps involved in it

Get step-by-step solutions from verified subject matter experts