

Question: Short Answer 17. A professor was curious about the relationship between absences and final grades in his introductory statistics course. The table below displays the
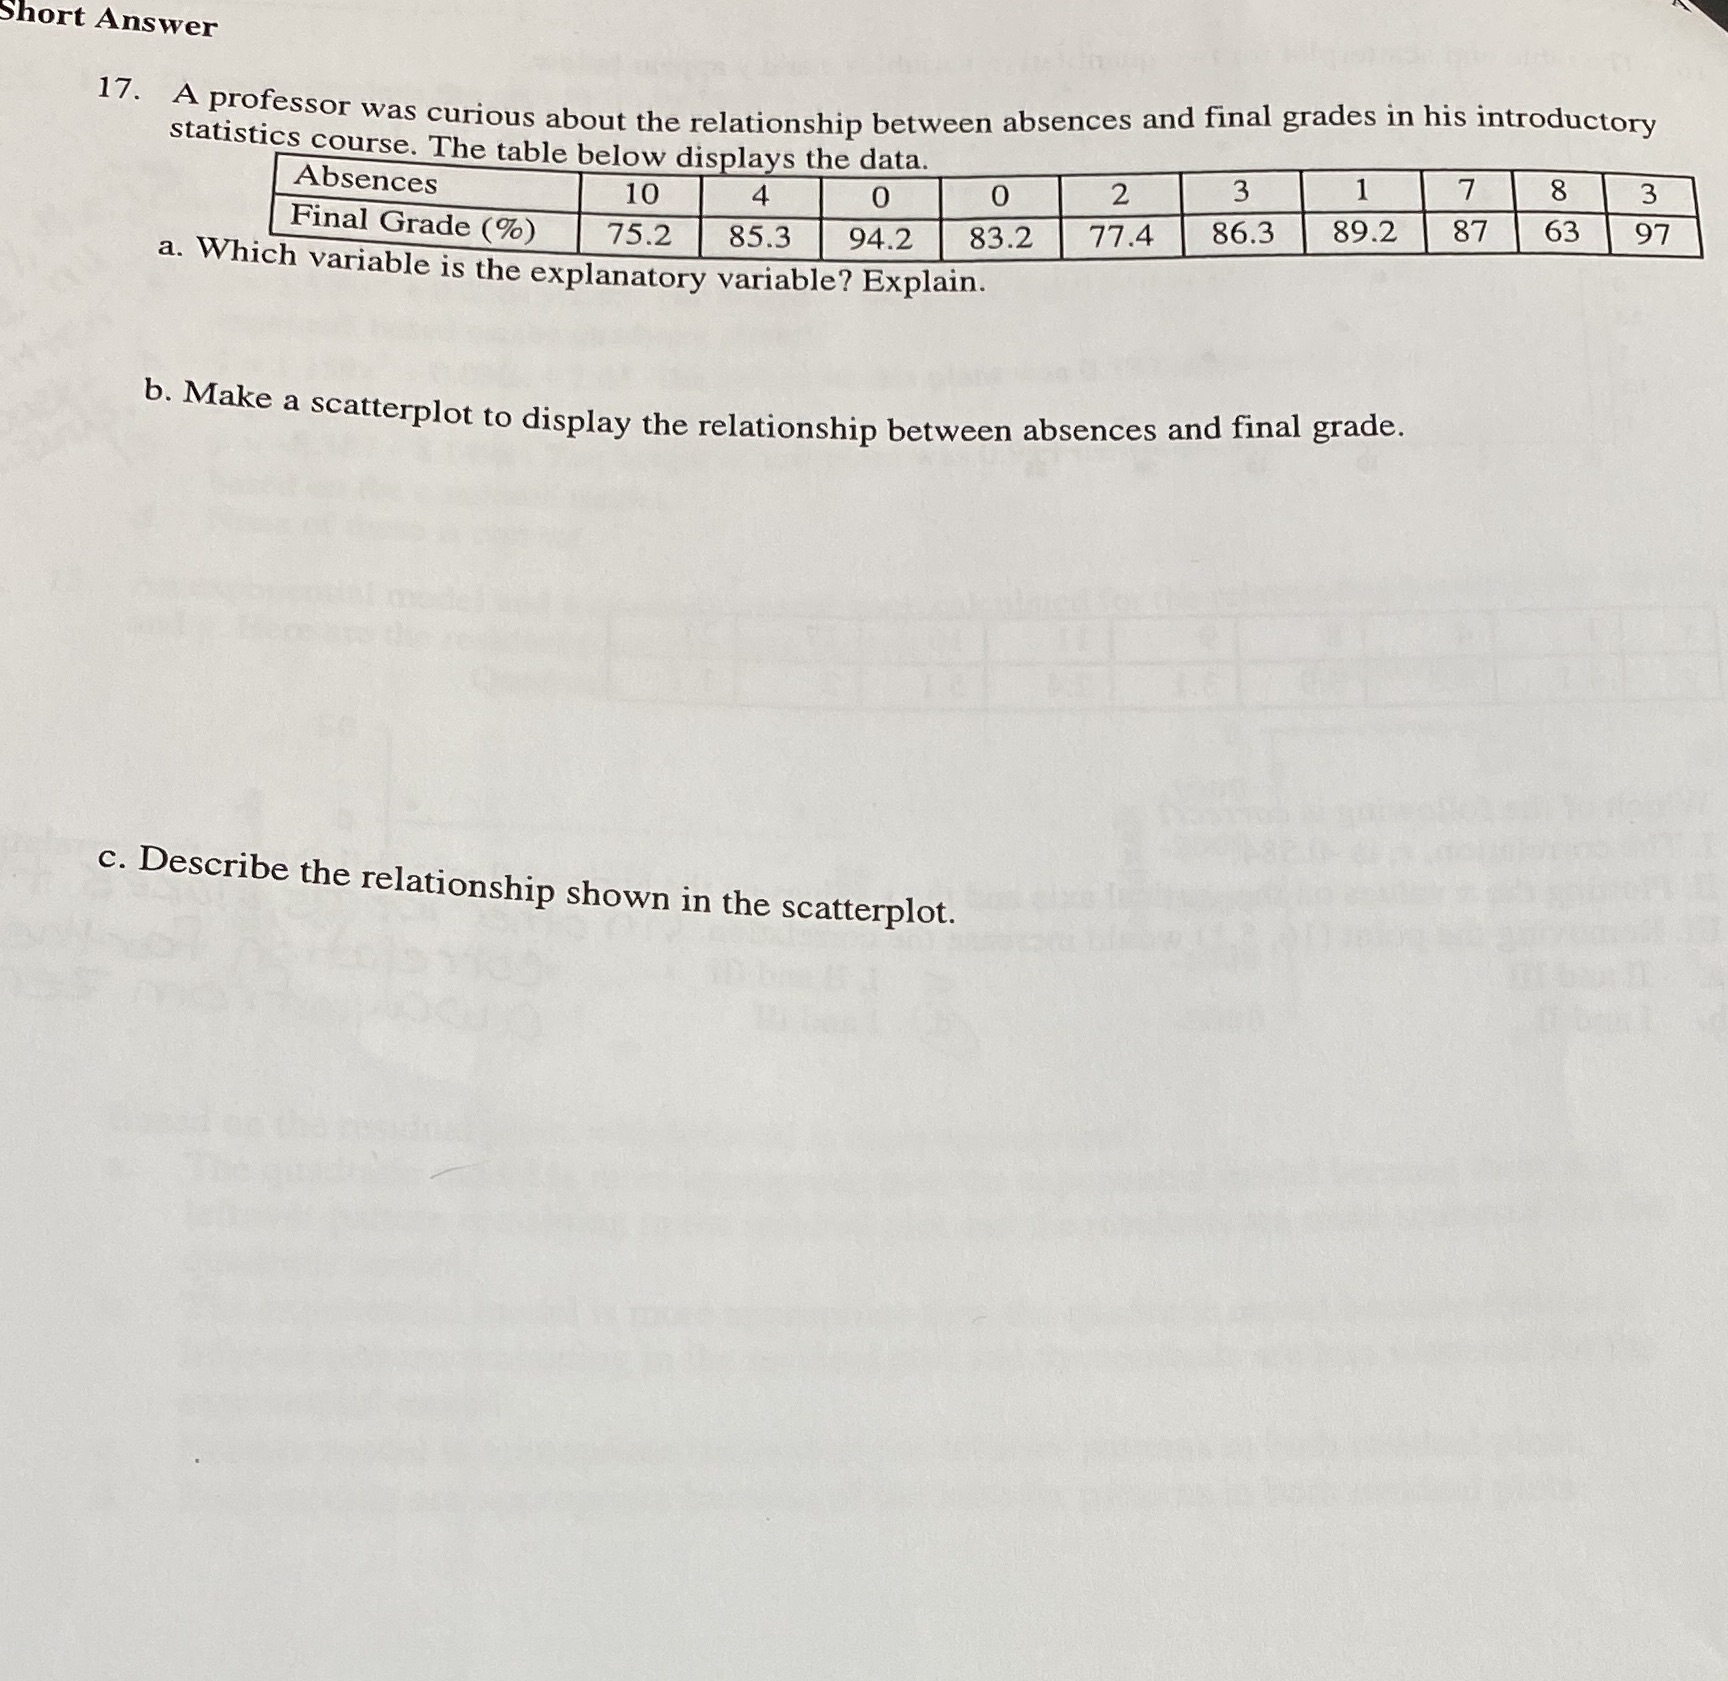
Short Answer 17. A professor was curious about the relationship between absences and final grades in his introductory statistics course. The table below displays the data. Absences 10 4 7 0 0 2 3 8 3 Final Grade (%) 75.2 85.3 94.2 83.2 77.4 86.3 89.2 87 63 97 a. Which variable is the explanatory variable? Explain. b. Make a scatterplot to display the relationship between absences and final grade. c. Describe the relationship shown in the scatterplot
Step by Step Solution
There are 3 Steps involved in it
1 Expert Approved Answer
Step: 1 Unlock

Question Has Been Solved by an Expert!
Get step-by-step solutions from verified subject matter experts
Step: 2 Unlock
Step: 3 Unlock