

Question: Hi, can someone help me with these questions? StatChapter11: Problem 6 Results for this submission 0.2559 0.2559 correct 0.343 0.343 correct 0.0699 0.0699 correct At
Hi, can someone help me with these questions?
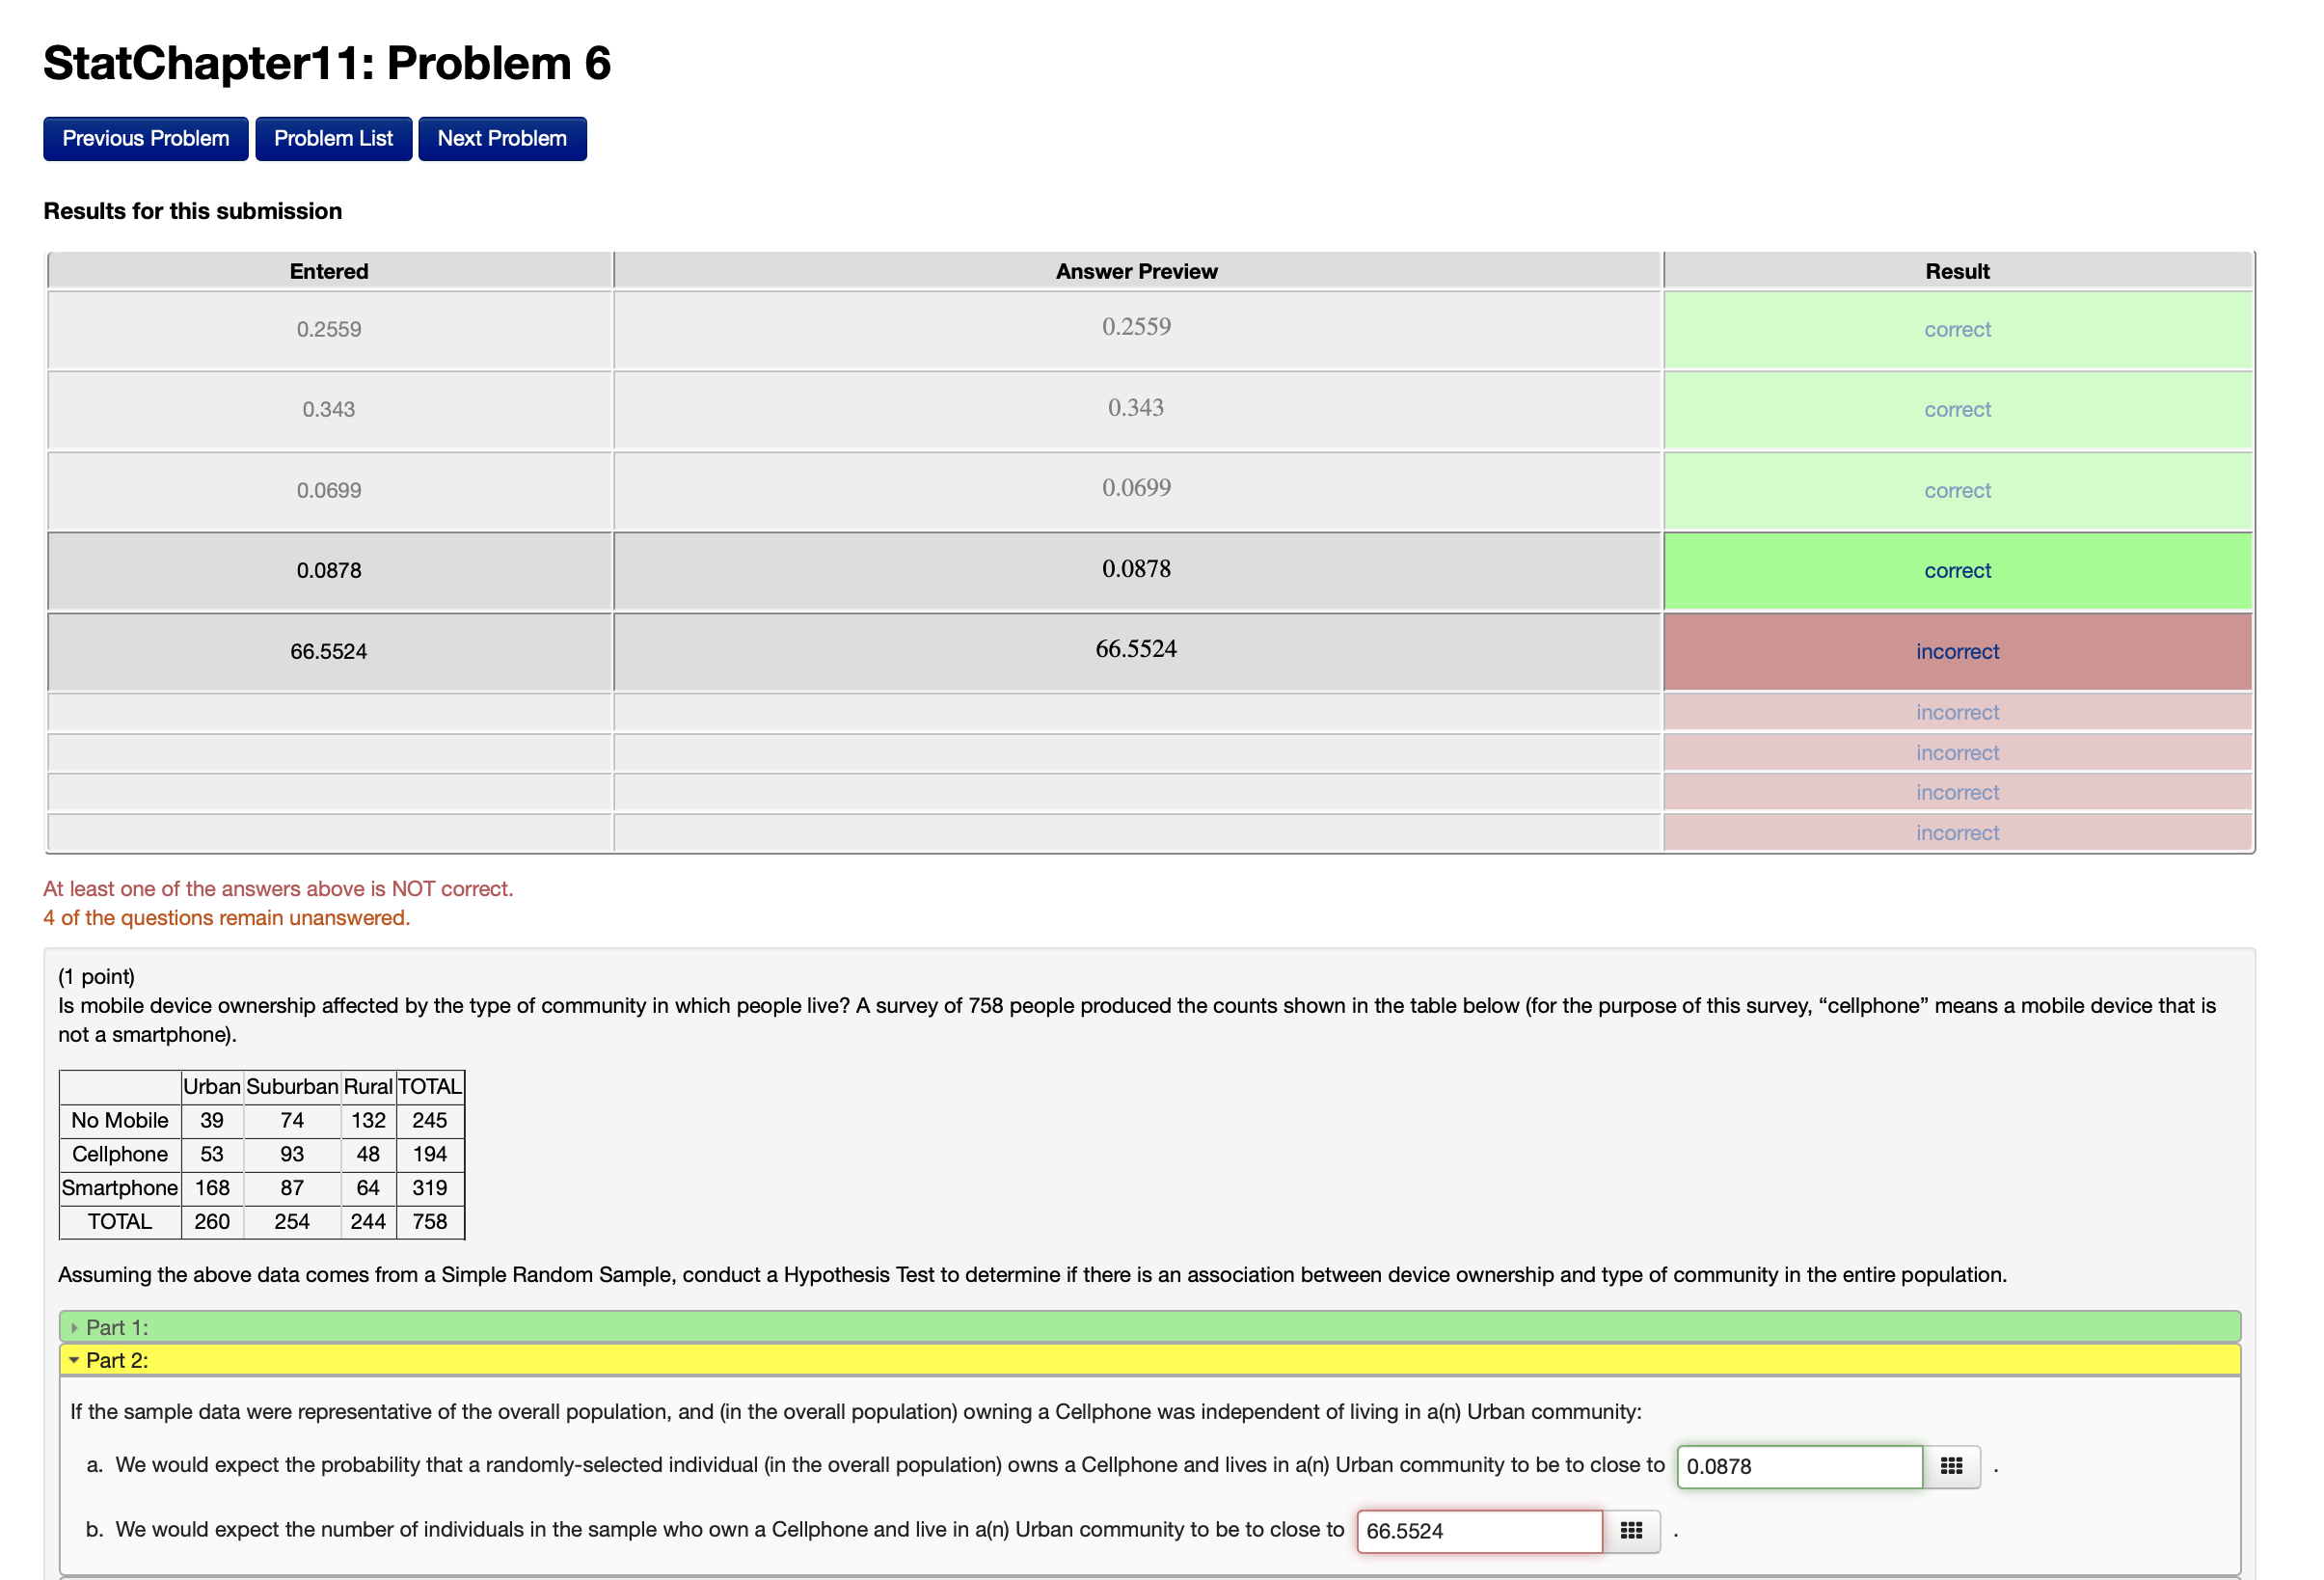
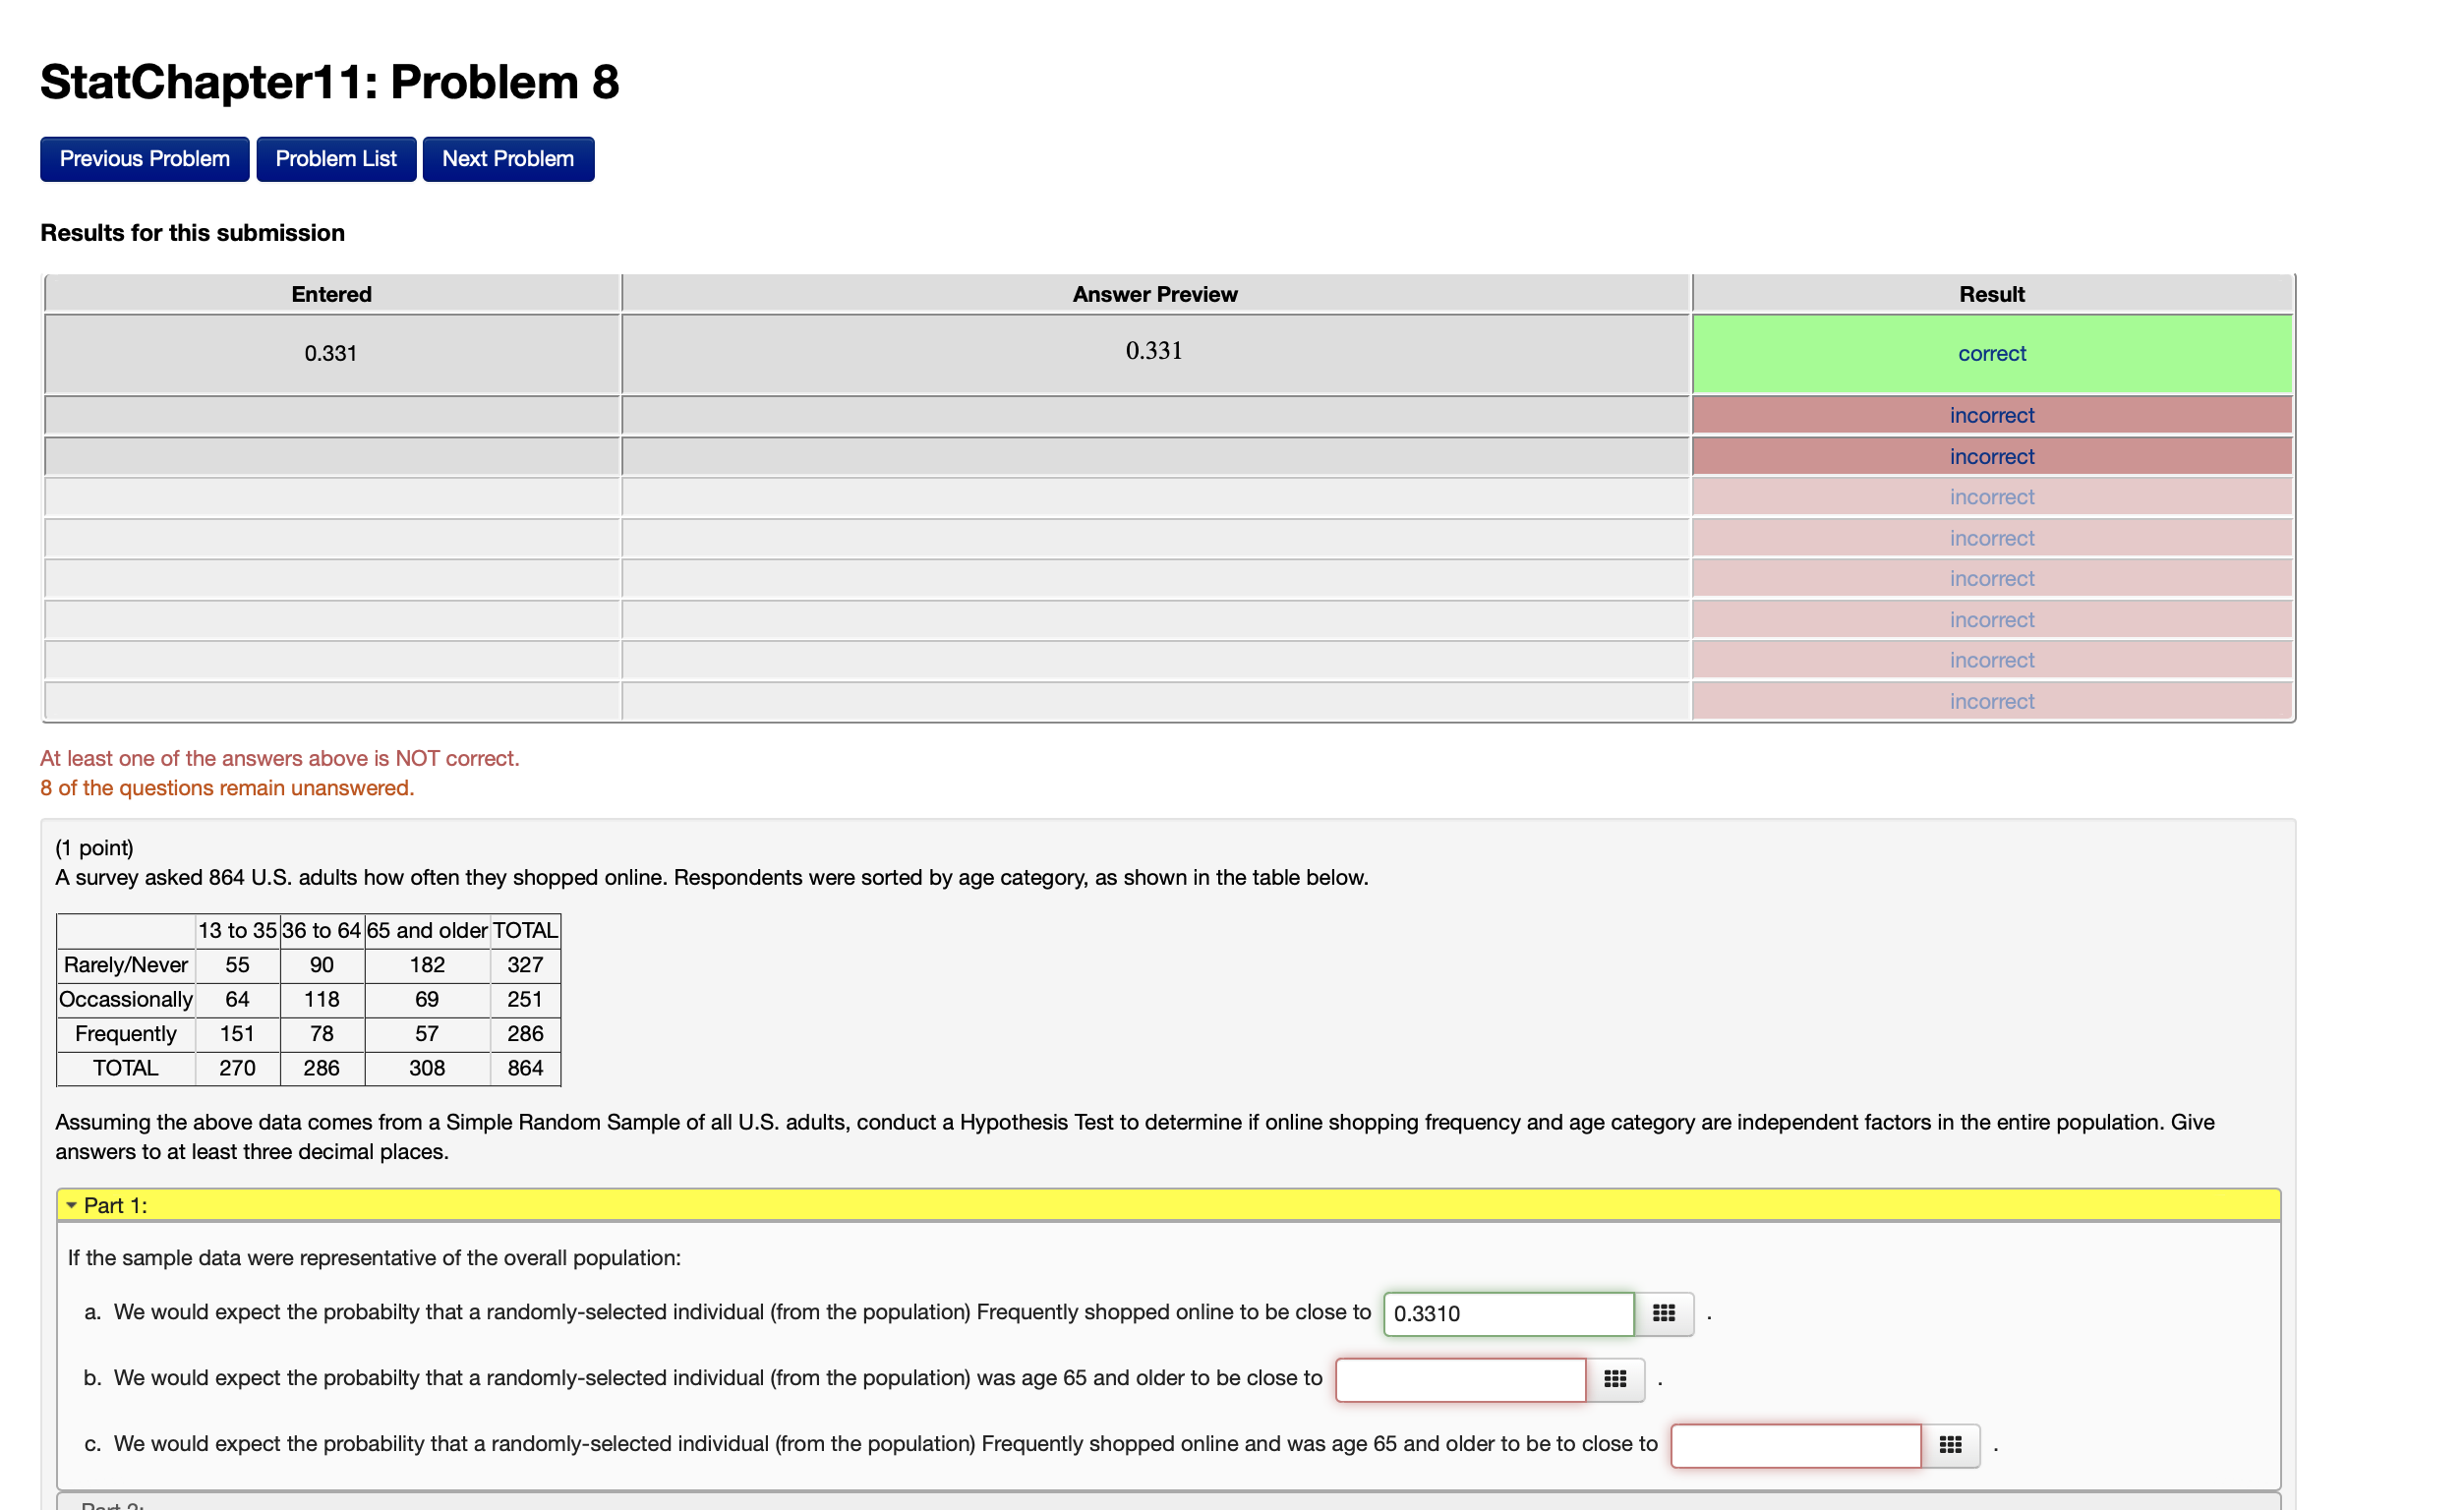
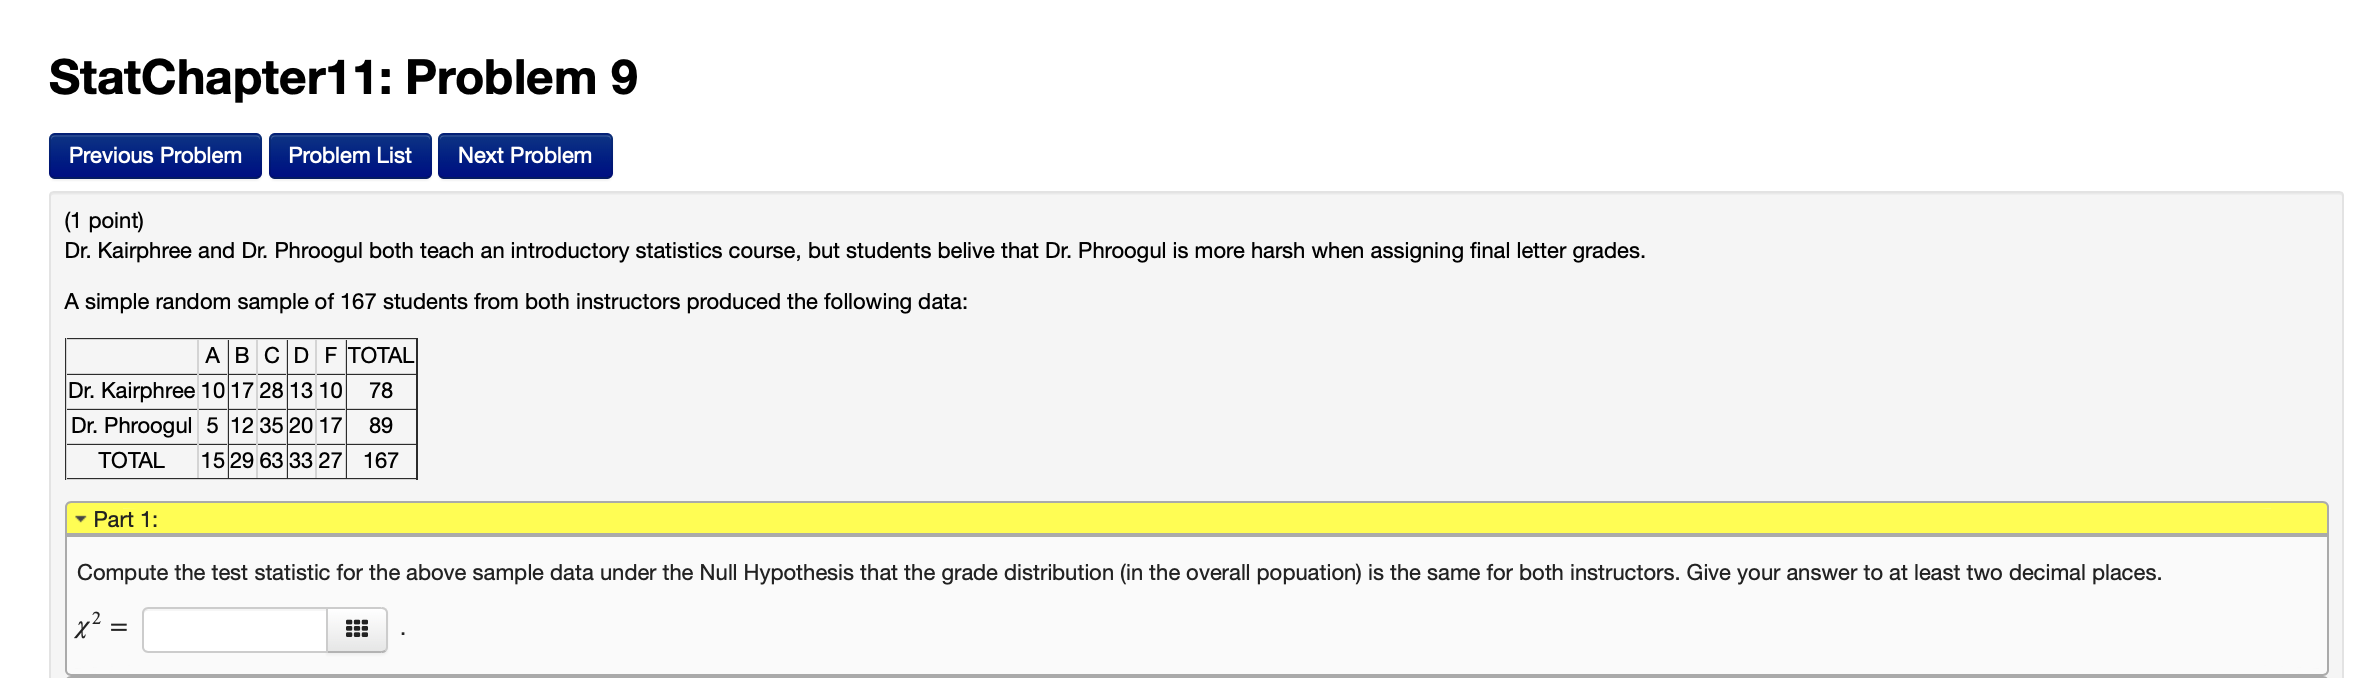
StatChapter11: Problem 6 Results for this submission 0.2559 0.2559 correct 0.343 0.343 correct 0.0699 0.0699 correct At least one of the answers above is NOT correct. 4 of the questions remain unanswered. (1 point) Is mobile device ownership affected by the type of community In which people live? A survey of 758 people produced the counts shown In the table below (for the purpose of this survey, \"ceilphone'I means a mobile device that Is not a smartphcne). Urban Suburban Rural TOTAL No Mobile 39 74 132 245 Cellphone 53 93 48 1 94 Srnartphone 1 68 87 64 31 9 TOTAL 260 254 244 758 Assuming the above data comes from a Simple Random Sample, conduct a Hypothesis Test to determine if there is an association between device ownership and type of community in the entire population. ' Part 2: If the sample data were representative of the overall population. and (In the overall population) owning a Cellphone was Independent of living In a(n) Urban community: a. We would expect the probablllty that a randomly-selected Indlvldual (In the overall population) owns a Cellphone and llves In a'n) Urban community to be to close to 0.0878 E . b. We would expect the number of individuals in the sample who own a Cellphone and live in sin) Urban community to be to close to 66.5524 u . StatChapter11: Problem 8 Previous Problem Problem List Next Problem Results for this submission Entered Answer Preview Result 0.331 0.331 correct incorrect incorrect incorrect ncorrect ncorrect incorrect incorrect incorrect At least one of the answers above is NOT correct. 8 of the questions remain unanswered. (1 point) A survey asked 864 U.S. adults how often they shopped online. Respondents were sorted by age category, as shown in the table below. 13 to 35 36 to 64 65 and older TOTAL Rarely/Never 55 90 182 327 Occassionally 64 118 69 251 Frequently 151 78 57 286 TOTAL 270 286 308 864 Assuming the above data comes from a Simple Random Sample of all U.S. adults, conduct a Hypothesis Test to determine if online shopping frequency and age category are independent factors in the entire population. Give answers to at least three decimal places. . Part 1: If the sample data were representative of the overall population: a. We would expect the probabilty that a randomly-selected individual (from the population) Frequently shopped online to be close to 0.3310 b. We would expect the probabilty that a randomly-selected individual (from the population) was age 65 and older to be close to c. We would expect the probability that a randomly-selected individual (from the population) Frequently shopped online and was age 65 and older to be to close toStatChapter11: Problem 9 Previous Problem Problem List Next Problem (1 point) Dr. Kairphree and Dr. Phroogul both teach an introductory statistics course, but students belive that Dr. Phroogul is more harsh when assigning final letter grades. A simple random sample of 167 students from both instructors produced the following data: ABCD F TOTAL Dr. Kairphree 10 17 28 13 10 78 Dr. Phroogul 5 12 35 20 17 89 TOTAL 15 29 63 33 27 167 - Part 1: Compute the test statistic for the above sample data under the Null Hypothesis that the grade distribution (in the overall popuation) is the same for both instructors. Give your answer to at least two decimal places. X' =
Step by Step Solution
There are 3 Steps involved in it

Get step-by-step solutions from verified subject matter experts