

Question: Short Case Identifying Anomalies through Data Visualization Purpose of the Case The purpose of this case is to apply critical thinking and visualization techniques to
Short Case Identifying Anomalies through Data Visualization
Purpose of the Case
The purpose of this case is to apply critical thinking and visualization techniques to a scenario that involves the audit of revenues and further practice data visualization in Tableau.
Background
You were recently promoted to audit senior at your firm, Aoife & Josephine LLP, and one of your primary clients is Souper Bowl Inc. Souper Bowl (the company) is a privately held business headquartered in Maine, and has a fiscal year-end of December 31. The company has been in business for nine years and prides itself on offering creative soups at a reasonable price and that are made with locally sourced ingredients. The most popular soups include sweet potato corn chowder, curried root vegetable and lentil, and maple-roasted butternut squash. Souper Bowl typically experiences increased sales during winter months since soup hits the spot on a cold and snowy day. To further encourage sales on days when customers often avoid venturing outside, the company provides a delivery service and guarantees that soup can be delivered to anyone no matter what the weather. The company found this strategy to be particularly successful in 2015 when New England (including Maine) experienced record snowfall during February and March.
Souper Bowl sells their soup at several restaurant locations throughout Maine. The company employs three managers that direct the day-to-day operations for a group of stores that are organized by approximate geographic region: northern Maine (Store Type 1), mid-Maine (Store Type 2), and coastal Maine (Store Type 3). Appendix A provides a map of these store locations. Each manager knows their local market well and has the flexibility to advertise and offer promotions with the overall goal of increasing sales year over year. If total sales at the end of the year exceed total sales from the prior year for that managers set of locations (i.e., Store Type), then the manager earns a monetary bonus from the company.
An audit of the company is required to comply with debt covenants related to a large bank loan that the company entered into when it began operations. Specifically, Souper Bowl must provide audited annual financial statements to the bank within 90 days of the fiscal year-end. The company must also provide unaudited quarterly financial statements to the bank within 45 days of the end of each quarter. The debt contract includes a financial covenant that requires pre-tax income in each quarter to be greater than zero. If not met, the bank has multiple remedies at its disposal, including calling the loan such that the entire balance is due immediately, seizing the companys assets that are posted as collateral, or providing a waiver for the violation. Souper Bowls net income for the year ended December 31, 2016 is $468,810, while net income for the prior year ended December 31, 2015 was $825,229.
Auditing Revenues
As part of your new role as audit senior, you will be performing a large portion of the planning and testing of sales for the 2016 audit of Souper Bowl. AU-C Section
1
1
240.26 states that when identifying and assessing the risks of material misstatement due to fraud, the auditor should, based on a presumption that risks of fraud exist in revenue recognition, evaluate which types of revenue, revenue transactions, or assertions give rise to such risks. During planning for the audit, the partner and manager determined that the following three management assertions represent significant risks for revenues:
(1) recorded sales occurred; (2) sales are accurately recorded; and (3) sales are recorded in the proper period.
In prior years, the audit approach relied on random sampling to test revenues. However, the partner wanted to develop more focused procedures in the current year to hone in on potentially riskier sales transactions. As a result, the plan is to perform disaggregated sales analytics to identify unusual trends in the daily sales data with the goal of identifying sales on specific days at specific store locations that should be subjected to substantive testing due to heightened risks. The remainder of the population would then be sampled using a random sampling approach.
Based on your experience from prior audits, you know that Souper Bowls daily sales fluctuate with temperature and snow accumulation. To perform your revenue analytics, you request a file from the client that includes daily sales by store location for both 2016 (current year) and 2015 (prior year). You also retrieve daily weather data from the National Oceanic and Atmospheric Administrations (NOAA) website for the weather centers closest to Souper Bowls store locations. Total revenue for the current year ended December 31, 2016 is $18.8 million, while total revenue for the prior year ended December 31, 2015 was $19.1 million. The audit teams workpapers include the following lead sheet for revenue testing, and the total balances for each year agree to the trial balance and the companys draft financial statements for 2016.
Souper Bowl Inc. Revenue Lead Sheet
31-Dec-16
2016 2015 change %change
Revenue, Store1 $4,062,390.97. $4,032,383.16. $30,007.81. 0.74%
Revenue, Store2. 9,331,175.81. 9,558,584.07. (227,408.26) -2.38%
Revenue, Store3 5,425,421.53. 5,546,767.89. (121,346.36). -2.19%
Total Revenue. $18,818,988.31. $19,137,735.12. $(318,746.81) -1.67%
Your manager stated that Tableau is a popular data visualization tool that your firm recently adopted and she instructed that you learn how to use it to perform these sales analytics. Since she is busy overseeing the planning and testing of other audit areas, she wants you to take the first pass and then document your results in a memo for her review. The manager wants you to provide thoughtful analyses and a thorough exploration of the possible relationships in the data. You are eager to impress her with your work, especially following your recent promotion to senior.
Task
In this case, you will assume the role of an auditor associate who is tasked by your manager to use analytics to identify high risk transactions. You will Tableau to develop data visualizations. You will be provided with an Excel workbook titled Souper_Bowl_Salesa.xlsx containing sales data for Souper Bowl of the three locations,
as well as the NOAA weather data.
Perform the tasks outlined below to complete this project:
- Auditing standards specifically require auditors to identify revenue recognition as a fraud risk in most audits. Based on your understanding of the company, what factors may increase the risk of fraudulent financial reporting in Souper Bowls 2016 revenues?
2. Import the case file data to Tableau. When you join the two tables, make sure you join them using both date and weather center location. Reproduce the Revenue Lead Sheet based on the sales data and check whether the information included in the case is correct or not.
3. Investigate the relationship between sales and weather using data in 2015. a. Visualize the relationship between sales and weather with Tableau. Consider
different measures for weather and possible variations across locations. b. Interpret the visualization you created. What is the relationship between sales
and weather?
4. Develop visualizations that identify potential outliers in the 2016 daily sales data. Document your analyses and conclusions as to the specific daily sales from certain locations that you recommend selecting for focused substantive testing.
Note: Your conclusion needs to be precise enough to pull specific transactions for example, you would not list the month of March in store 1010 because this would result in too many observations to feasibly test. Also, you should not recommend testing observations from 2015. Your engagement team completed that audit in the prior yearinstead, you are using 2015 data as a benchmark for 2016.
5. Present your findings in a brief presentation for your manager. Outline your recommendations and the visualizations which support those recommendations.
Submission Requirements:
Team leader needs to submit the following deliverables before your presentation to your professor through email:
Your Tableau workbook which includes the data visualizations in requirements 2, 3 and 4. When you save your Tableau workbook, please save as Tableau Packaged workbook with the twbx extension.
Your recorded presentation which should address each of requirements.
Please save all your files with the name convention of the following: [Lastname of team members]_SouperBowl_case.twbx
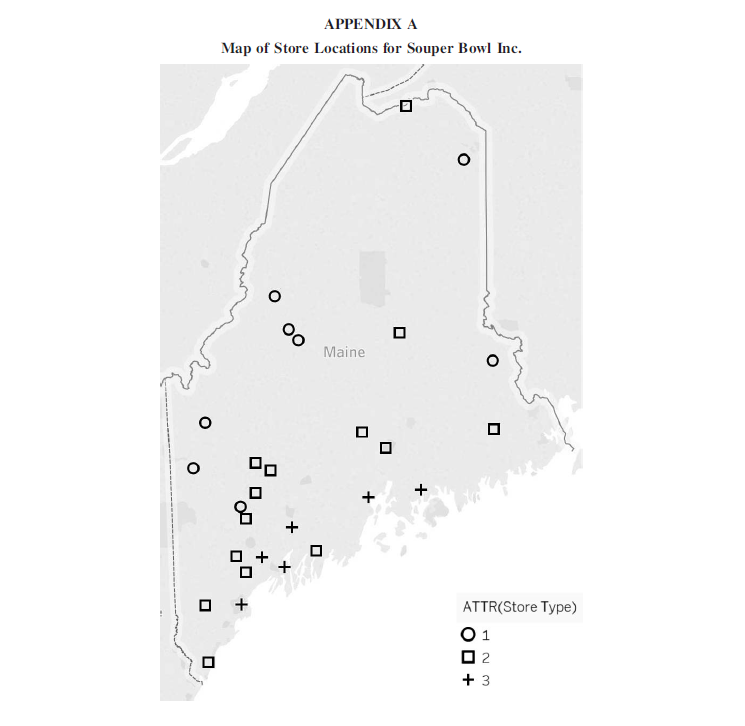
APPENDIX A Map of Store Locations for Souper Bowl Inc. APPENDIX A Map of Store Locations for Souper Bowl Inc
Step by Step Solution
There are 3 Steps involved in it

Get step-by-step solutions from verified subject matter experts