

Question: [Short-Answer) Based on the Excel outputs below, answer the questions. (Q U.I). ANOVA df SS MS F Significance F Regression 1 44.46296 1.396472 Residual 6
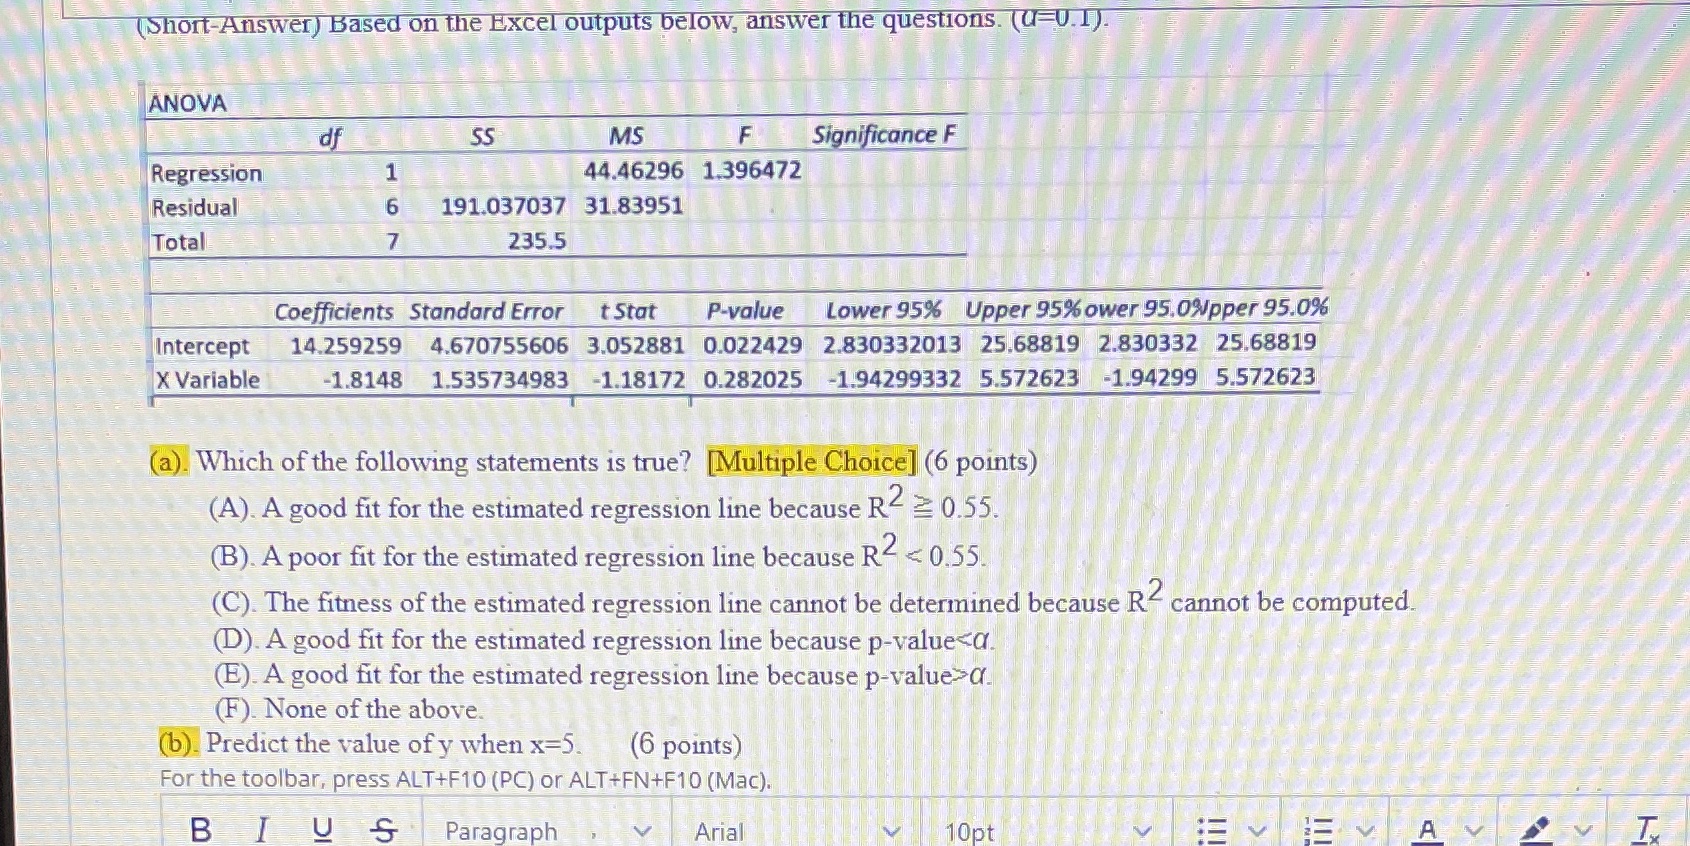
[Short-Answer) Based on the Excel outputs below, answer the questions. (Q U.I). ANOVA df SS MS F Significance F Regression 1 44.46296 1.396472 Residual 6 191.037037 31.83951 Total 7 235.5 Coefficients Standard Error tStat P-value Lower 95% Upper 95% ower 95.0%pper 95.0% Intercept 14.259259 4.670755606 3.052881 0.022429 2.830332013 25.68819 2.830332 25,68819 X Variable -1.8148 1.535734983 -1.18172 0.282025 -1.94299332 5.572623 -1.94299 5.572623 (a). Which of the following statements is true? [Multiple Choice] (6 points) (A). A good fit for the estimated regression line because R- = 0.55. (B). A poor fit for the estimated regression line because R2 = 0.55. (C). The fitness of the estimated regression line cannot be determined because R cannot be computed. (D). A good fit for the estimated regression line because p-value
Step by Step Solution
There are 3 Steps involved in it

Get step-by-step solutions from verified subject matter experts