

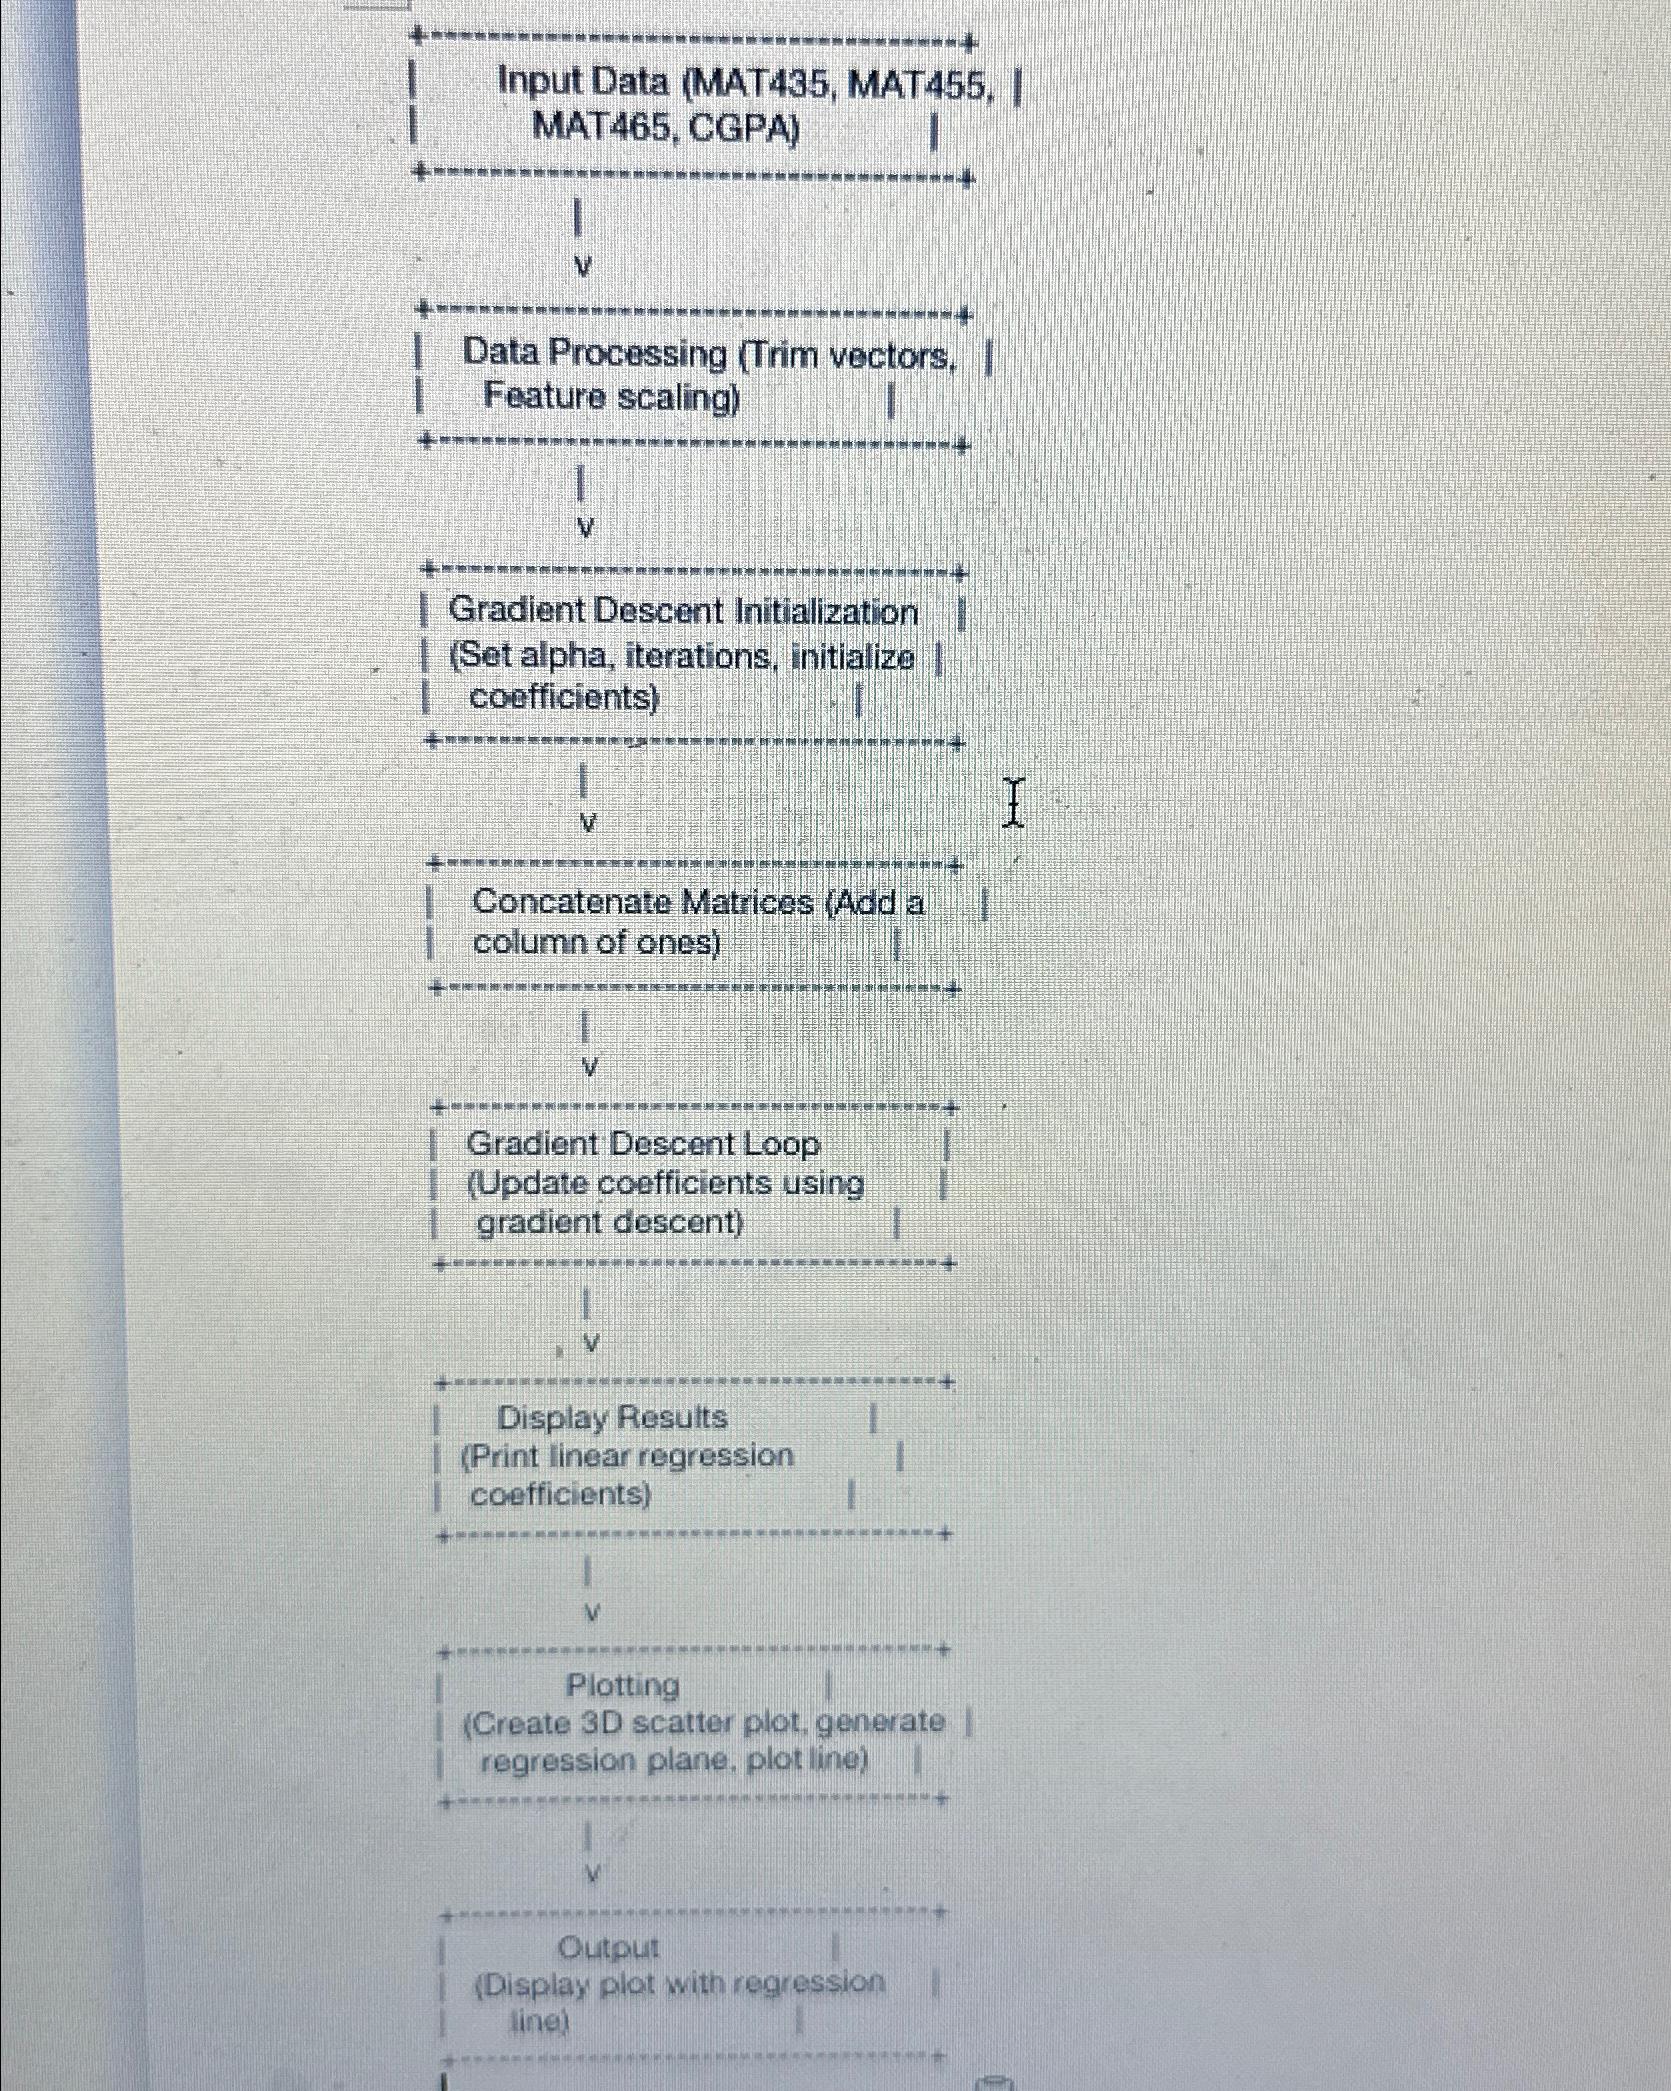
Question: Show a Flowchart based on the given diagram. Display Results ( Print linear regression coefficients ) 1 I 1 I Plotting ( Create 3 D
Show a Flowchart based on the given diagram.
Display Results
Print linear regression
coefficients
I
I
Plotting
Create D scatter plot, generate regression plane, plot line
Output
Display plot with regression tine
Step by Step Solution
There are 3 Steps involved in it
1 Expert Approved Answer
Step: 1 Unlock

Question Has Been Solved by an Expert!
Get step-by-step solutions from verified subject matter experts
Step: 2 Unlock
Step: 3 Unlock