

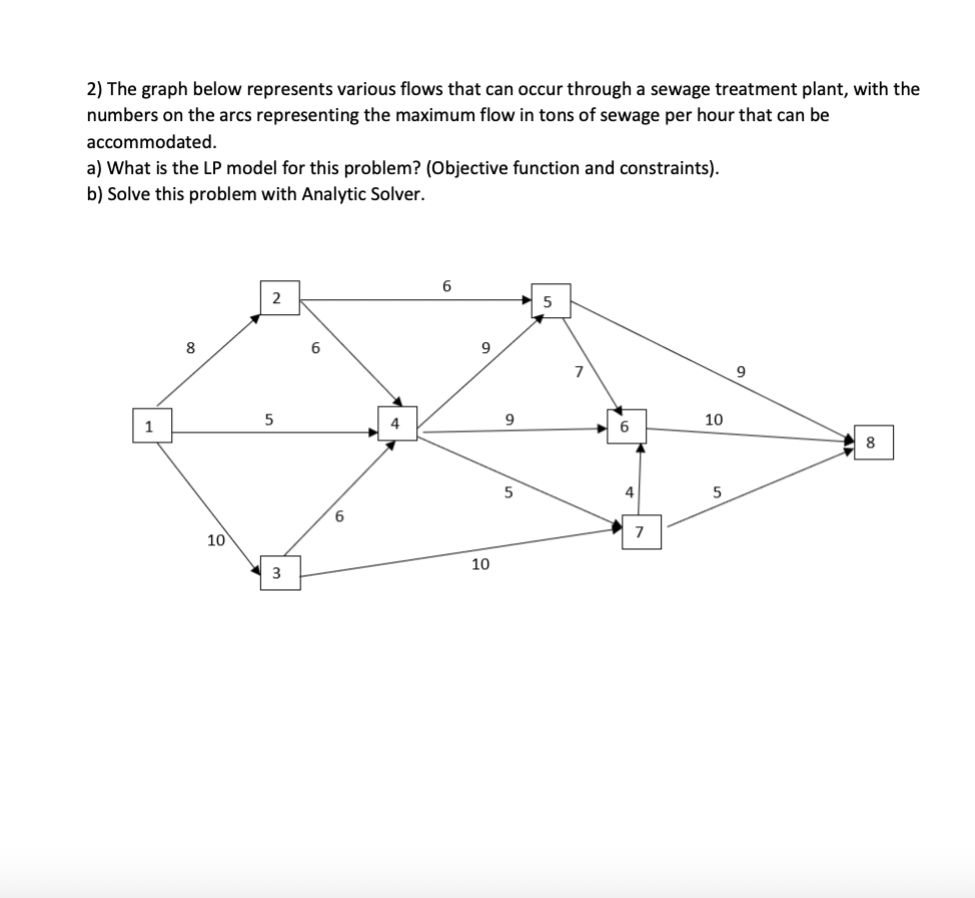
Question: SHOW ALL STEPS AND I NEED THIS DONE ASAP PLEASE 2) The graph below represents various flows that can occur through a sewage treatment plant,
 SHOW ALL STEPS AND I NEED THIS DONE ASAP PLEASE
Step by Step Solution
There are 3 Steps involved in it
1 Expert Approved Answer
Step: 1 Unlock

Question Has Been Solved by an Expert!
Get step-by-step solutions from verified subject matter experts
Step: 2 Unlock
Step: 3 Unlock