

Question: Show all work and formulas This homework is a continuation of HMWK 6. Assume that you evaluated four forecasting models: 1) moving average, n=2, 2)
 Show all work and formulas
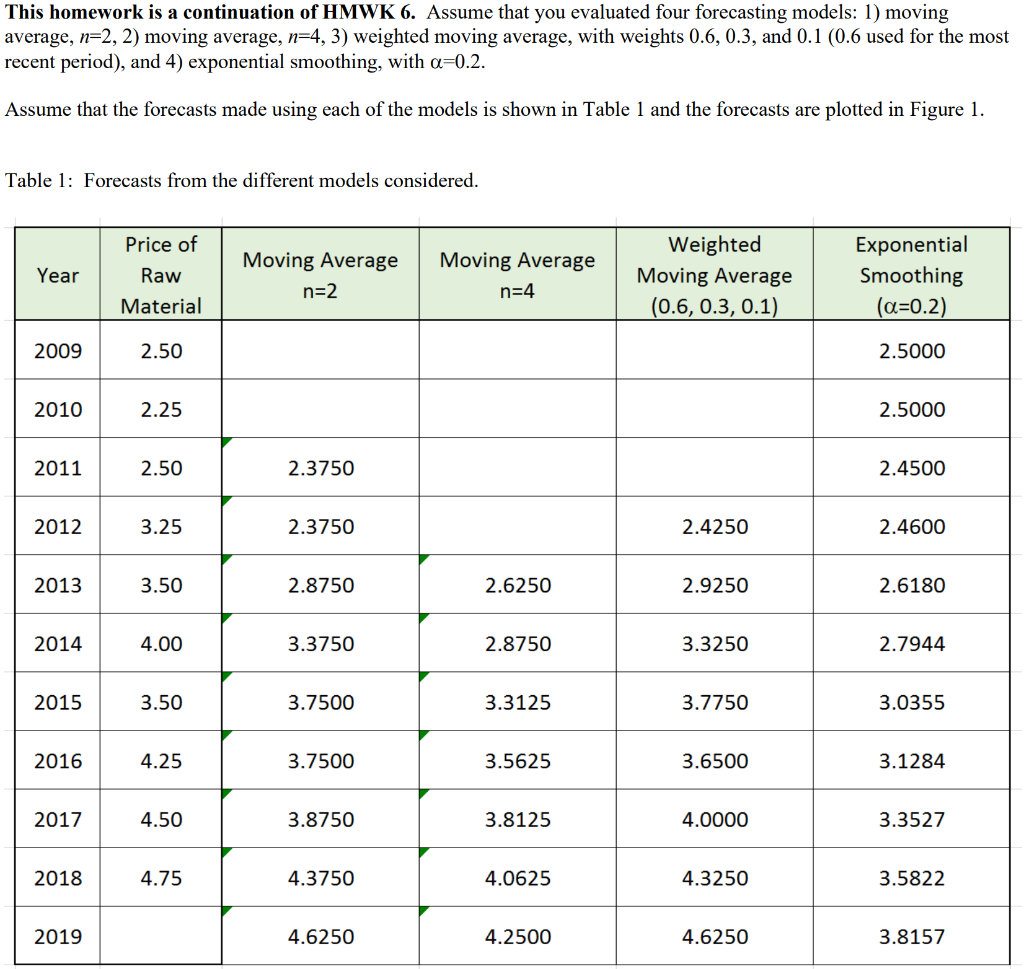
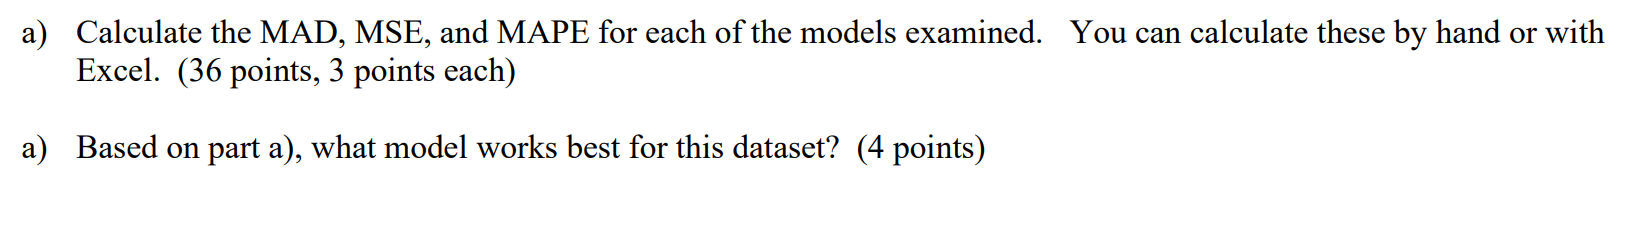
This homework is a continuation of HMWK 6. Assume that you evaluated four forecasting models: 1) moving average, n=2, 2) moving average, n=4, 3) weighted moving average, with weights 0.6, 0.3, and 0.1 (0.6 used for the most recent period), and 4) exponential smoothing, with a=0.2. Assume that the forecasts made using each of the models is shown in Table 1 and the forecasts are plotted in Figure 1. Table 1: Forecasts from the different models considered. Price of Year Raw Material Moving Average n=2 Moving Average n=4 Weighted Moving Average (0.6, 0.3, 0.1) Exponential Smoothing (a=0.2) 2009 2.50 2.5000 2010 2.25 2.5000 2011 2.50 2.3750 2.4500 2012 3.25 2.3750 2.4250 2.4600 2013 3.50 2.8750 2.6250 2.9250 2.6180 2014 4.00 3.3750 2.8750 3.3250 2.7944 2015 3.50 3.7500 3.3125 3.7750 3.0355 2016 4.25 3.7500 3.5625 3.6500 3.1284 2017 4.50 3.8750 3.8125 4.0000 3.3527 2018 4.75 4.3750 4.0625 4.3250 3.5822 2019 4.6250 4.2500 4.6250 3.8157 a) Calculate the MAD, MSE, and MAPE for each of the models examined. You can calculate these by hand or with Excel. (36 points, 3 points each) a) Based on part a), what model works best for this dataset? (4 points) This homework is a continuation of HMWK 6. Assume that you evaluated four forecasting models: 1) moving average, n=2, 2) moving average, n=4, 3) weighted moving average, with weights 0.6, 0.3, and 0.1 (0.6 used for the most recent period), and 4) exponential smoothing, with a=0.2. Assume that the forecasts made using each of the models is shown in Table 1 and the forecasts are plotted in Figure 1. Table 1: Forecasts from the different models considered. Price of Year Raw Material Moving Average n=2 Moving Average n=4 Weighted Moving Average (0.6, 0.3, 0.1) Exponential Smoothing (a=0.2) 2009 2.50 2.5000 2010 2.25 2.5000 2011 2.50 2.3750 2.4500 2012 3.25 2.3750 2.4250 2.4600 2013 3.50 2.8750 2.6250 2.9250 2.6180 2014 4.00 3.3750 2.8750 3.3250 2.7944 2015 3.50 3.7500 3.3125 3.7750 3.0355 2016 4.25 3.7500 3.5625 3.6500 3.1284 2017 4.50 3.8750 3.8125 4.0000 3.3527 2018 4.75 4.3750 4.0625 4.3250 3.5822 2019 4.6250 4.2500 4.6250 3.8157 a) Calculate the MAD, MSE, and MAPE for each of the models examined. You can calculate these by hand or with Excel. (36 points, 3 points each) a) Based on part a), what model works best for this dataset? (4 points)
Step by Step Solution
There are 3 Steps involved in it

Get step-by-step solutions from verified subject matter experts