

Question: show all work please! 5. (a) Explain the scree graph and describe how you will use it determining the number of principal components to be
show all work please!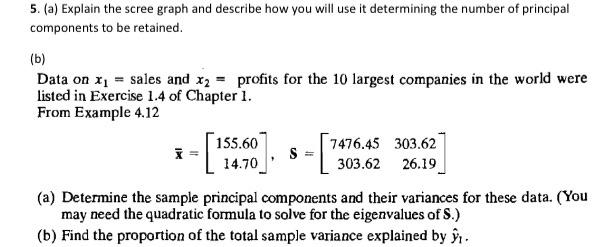
5. (a) Explain the scree graph and describe how you will use it determining the number of principal components to be retained. (b) Data on x = sales and x2 = profits for the 10 largest companies in the world were listed in Exercise 1.4 of Chapter 1. From Example 4.12 155.60 7476.45 303.62 S 14.70 303.62 26.19 (a) Determine the sample principal components and their variances for these data. (You may need the quadratic formula to solve for the eigenvalues of S.) (b) Find the proportion of the total sample variance explained by r
Step by Step Solution
There are 3 Steps involved in it
1 Expert Approved Answer
Step: 1 Unlock

Question Has Been Solved by an Expert!
Get step-by-step solutions from verified subject matter experts
Step: 2 Unlock
Step: 3 Unlock