

Question: Show all work please Show All Work!!! 1) For the studies described, identify the population, sample, population parameters, and sample statistics: The mean income of
Show all work please
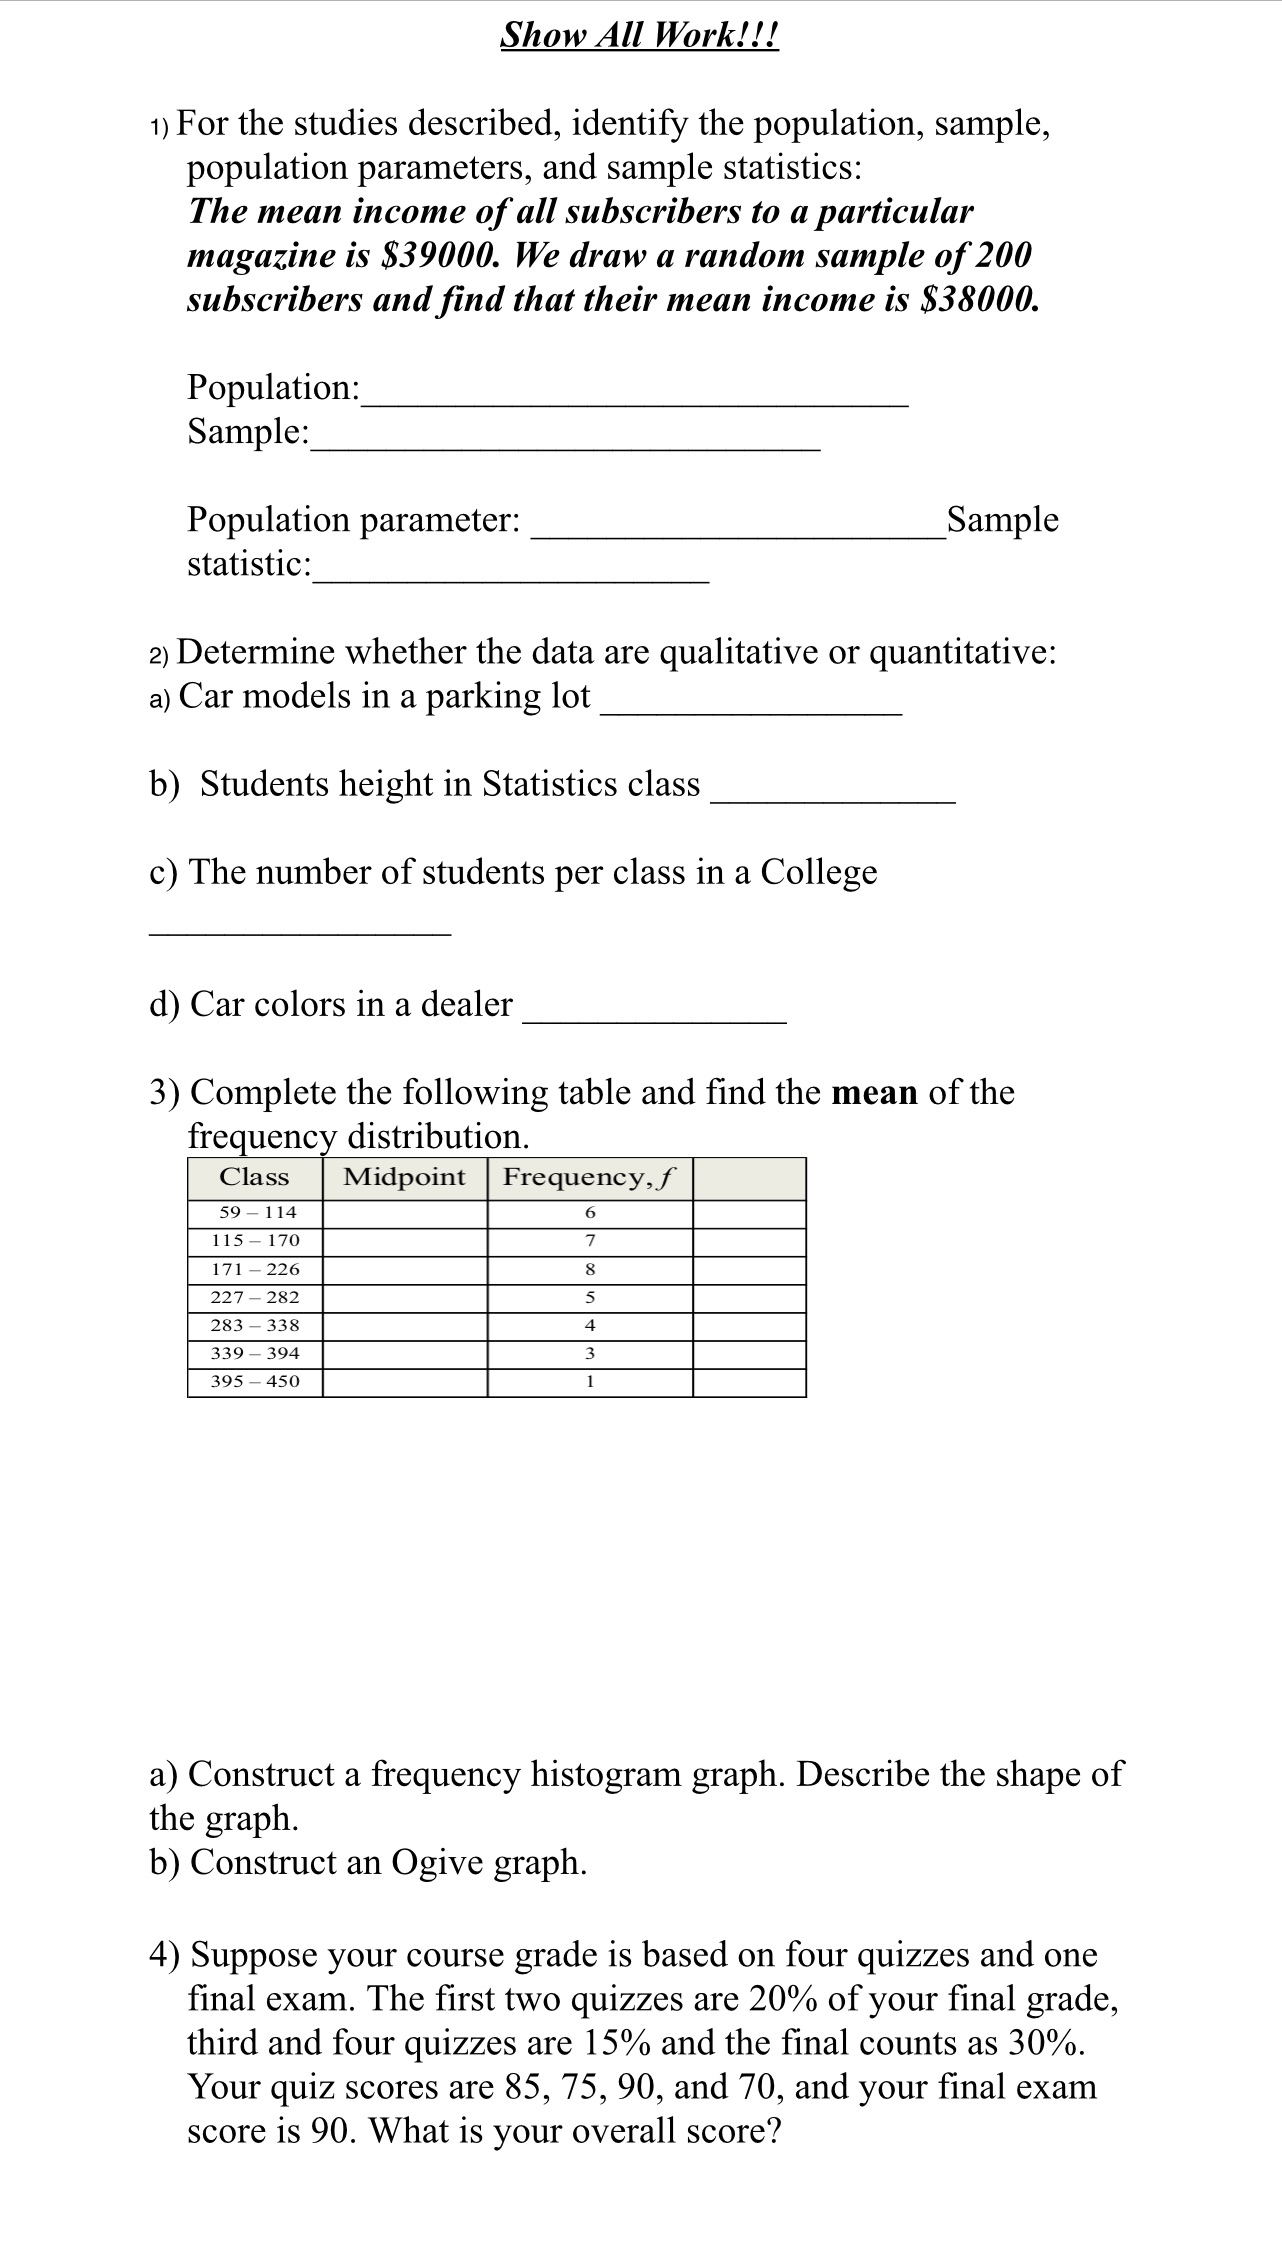
Show All Work!!! 1) For the studies described, identify the population, sample, population parameters, and sample statistics: The mean income of all subscribers to a particular magazine is $39000. We draw a random sample of 200 subscribers and find that their mean income is $38000. Population: Sample: Population parameter: Sample statistic: 2) Determine whether the data are qualitative or quantitative: a) Car models in a parking lot b) Students height in Statistics class c) The number of students per class in a College d) Car colors in a dealer 3) Complete the following table and nd the mean of the frequency distribution. ' Class Midpoint Frequency,f l 59 114 o 115 170 a) Construct a frequency histogram graph. Describe the shape of the graph. b) Construct an Ogive graph. 4) Suppose your course grade is based on four quizzes and one final exam. The first two quizzes are 20% of your nal grade, third and four quizzes are 15% and the nal counts as 30%. Your quiz scores are 85, 75, 90, and 70, and your final exam score is 90. What is your overall score
Step by Step Solution
There are 3 Steps involved in it

Get step-by-step solutions from verified subject matter experts