

Question: Show all work Question 9 U Pts Carty University Enrollment (in Carty A&M Enrollment (in Year thousands) thousands) 2005 12 8 2015 18 15 Above
Show all work
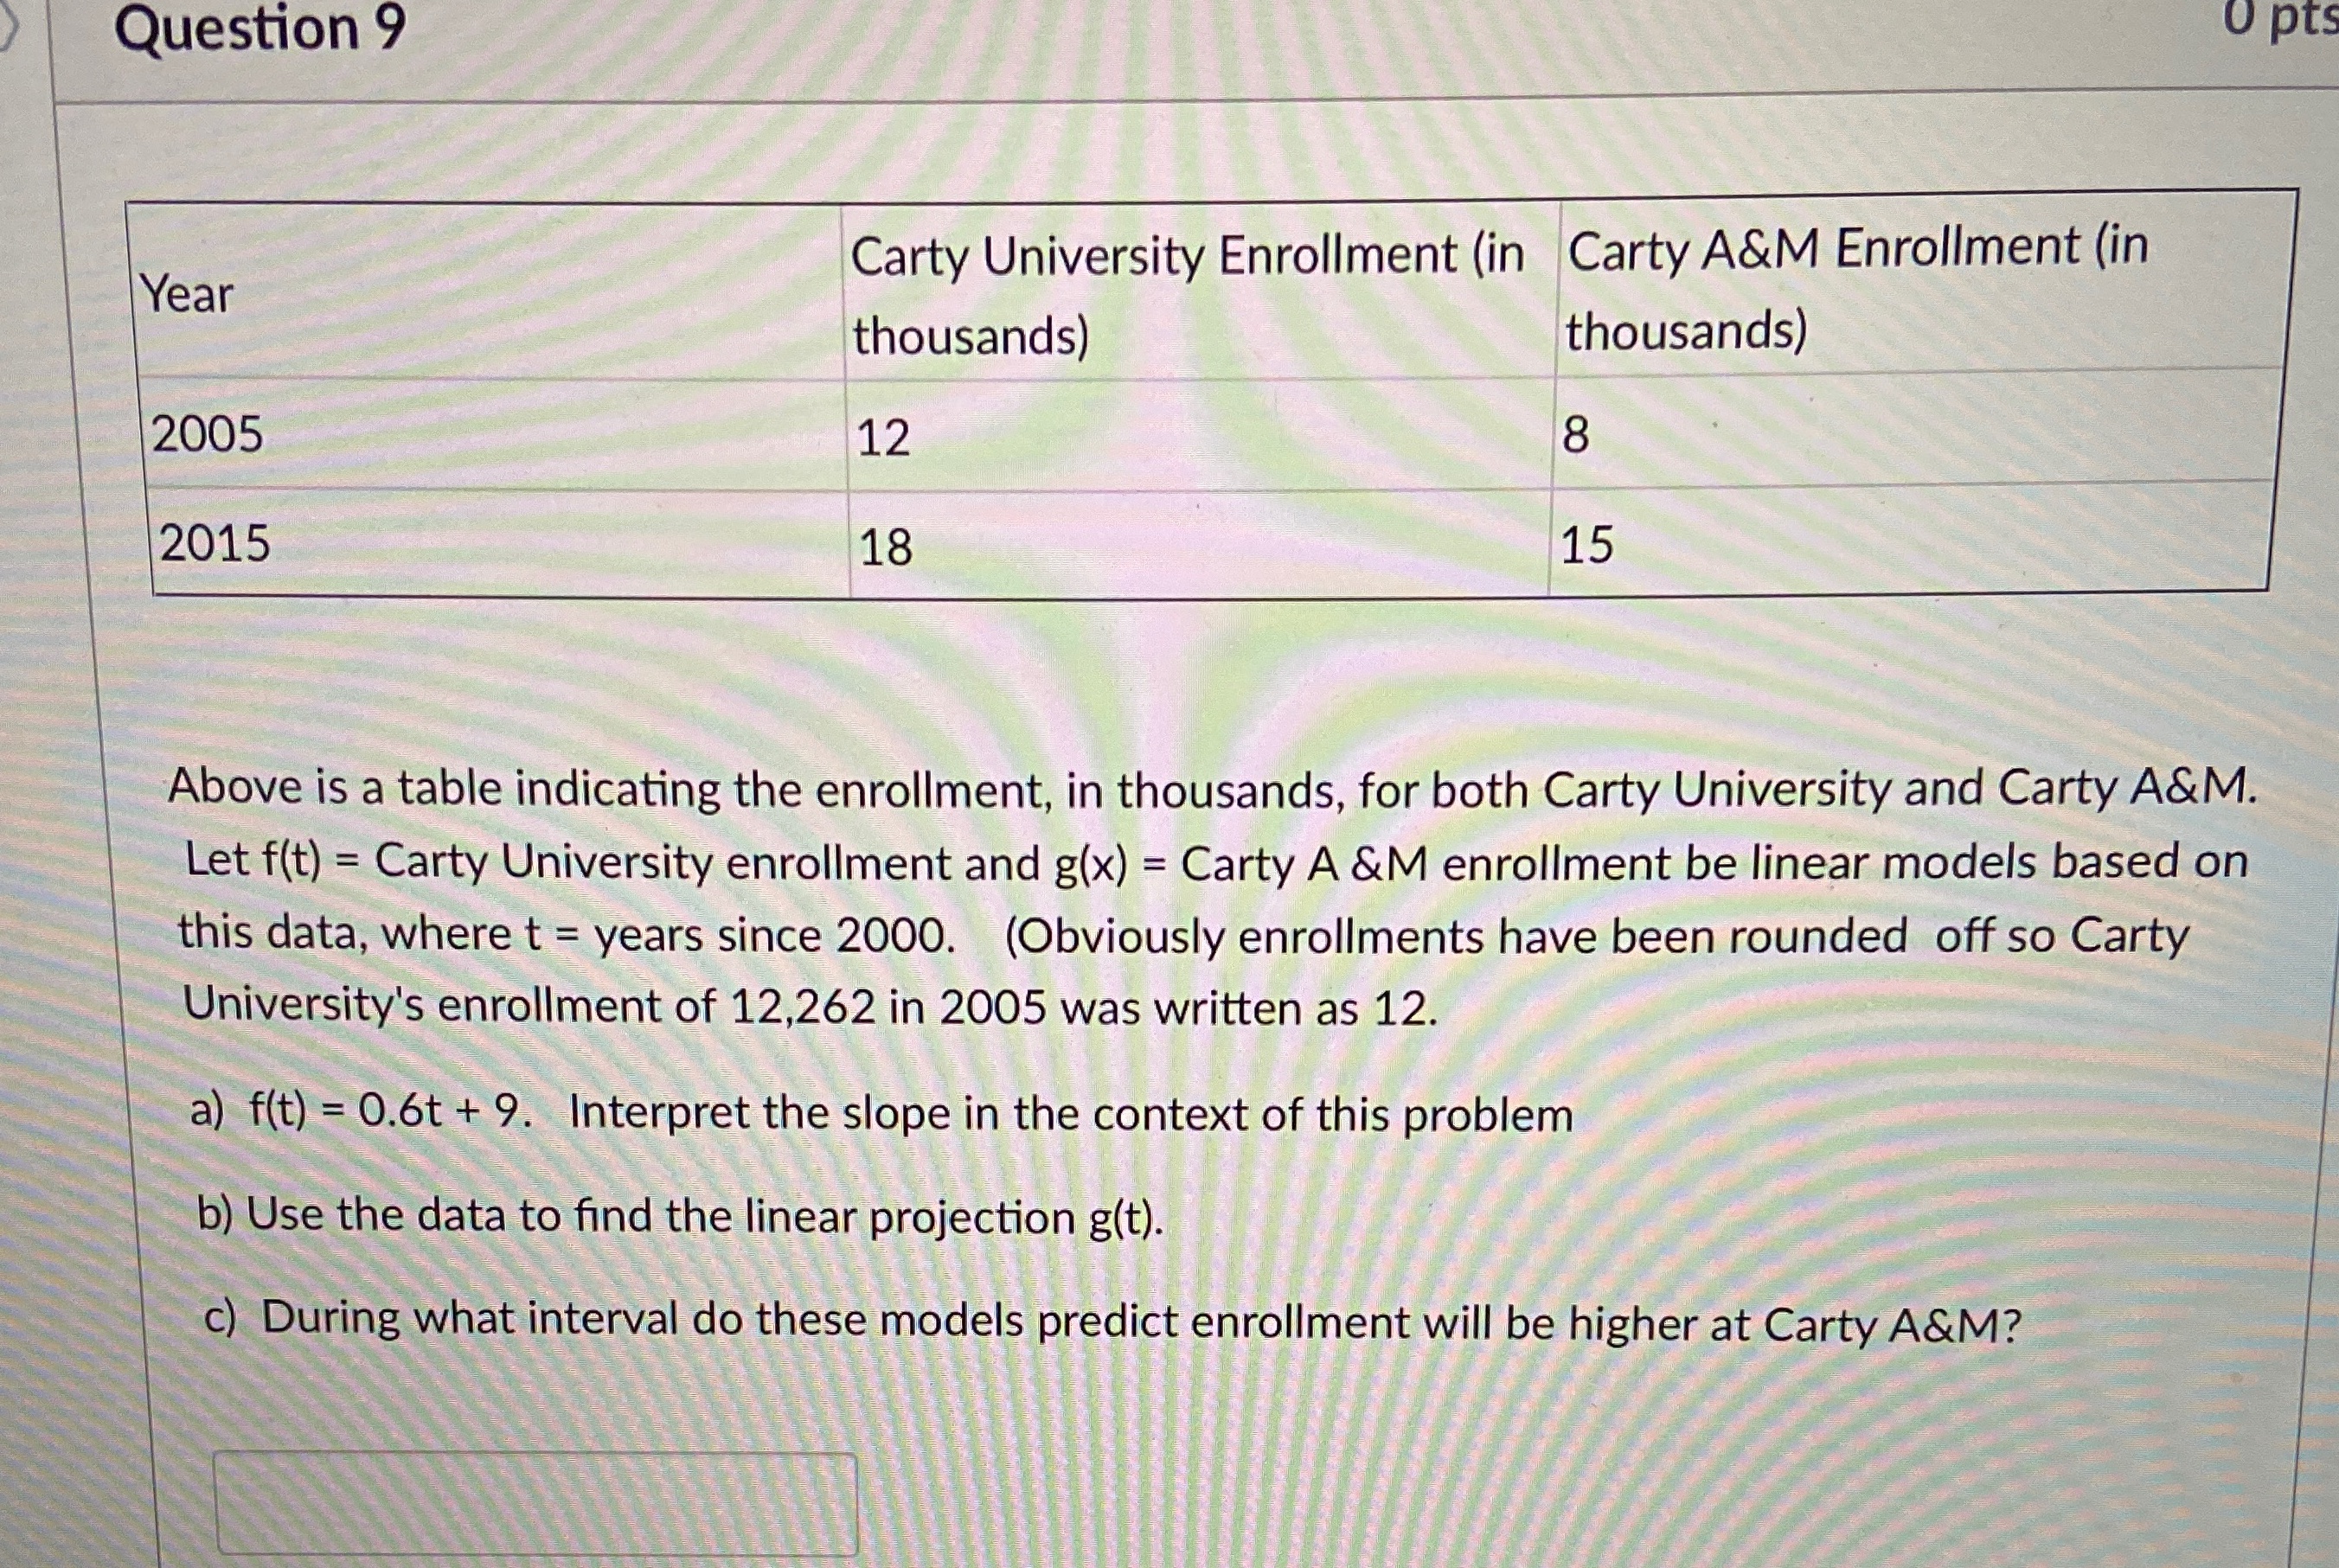
Question 9 U Pts Carty University Enrollment (in Carty A&M Enrollment (in Year thousands) thousands) 2005 12 8 2015 18 15 Above is a table indicating the enrollment, in thousands, for both Carty University and Carty A&M. Let f(t) = Carty University enrollment and g(x) = Carty A &M enrollment be linear models based on this data, where t = years since 2000. (Obviously enrollments have been rounded off so Carty University's enrollment of 12,262 in 2005 was written as 12. a) f(t) = 0.6t + 9. Interpret the slope in the context of this problem b) Use the data to find the linear projection g(t). c) During what interval do these models predict enrollment will be higher at Carty A&M
Step by Step Solution
There are 3 Steps involved in it

Get step-by-step solutions from verified subject matter experts