

Question: show all work show all work and type all answers Print this chromatogram and use a ruler to measure the values for retention time and
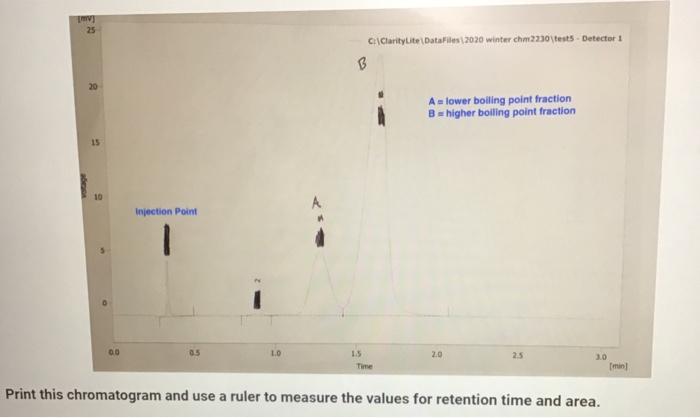
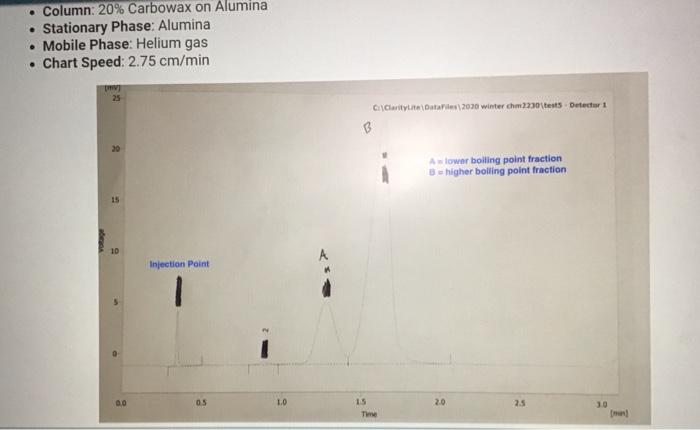
Print this chromatogram and use a ruler to measure the values for retention time and area. Print this chromatogram and use a ruler to measure the values for retention time and area. (Opts) Chart Speed: GC data for products Table view List view Peak 2 Peak 3 Percent composition of products Table view List view Composition (\%) Percent Composition (\%) Peak 1 Peak 2 Peak 3 - Column: 20\% Carbowax on Alumina - Stationary Phase: Alumina - Mobile Phase: Helium gas - Chart Speed: 2.75cm/min Table view List view Retention time (s) \& peak area (cm2) Retention Time Area of Peak Peak 1 Peak 2 Peak 3 Percent composition of products Table view D List view Composition (\%) Percent Composition (\%) Peak 1 Percent Composition (\%) Peak 1 Peak 2 Peak 3 Print this chromatogram and use a ruler to measure the values for retention time and area. Print this chromatogram and use a ruler to measure the values for retention time and area. (Opts) Chart Speed: GC data for products Table view List view Peak 2 Peak 3 Percent composition of products Table view List view Composition (\%) Percent Composition (\%) Peak 1 Peak 2 Peak 3 - Column: 20\% Carbowax on Alumina - Stationary Phase: Alumina - Mobile Phase: Helium gas - Chart Speed: 2.75cm/min Table view List view Retention time (s) \& peak area (cm2) Retention Time Area of Peak Peak 1 Peak 2 Peak 3 Percent composition of products Table view D List view Composition (\%) Percent Composition (\%) Peak 1 Percent Composition (\%) Peak 1 Peak 2 Peak 3
Step by Step Solution
There are 3 Steps involved in it

Get step-by-step solutions from verified subject matter experts