

Question: Show all workings without using excel or if you did use excel can you also put in the functions that you use. Thank you! You
Show all workings without using excel or if you did use excel can you also put in the functions that you use. Thank you!
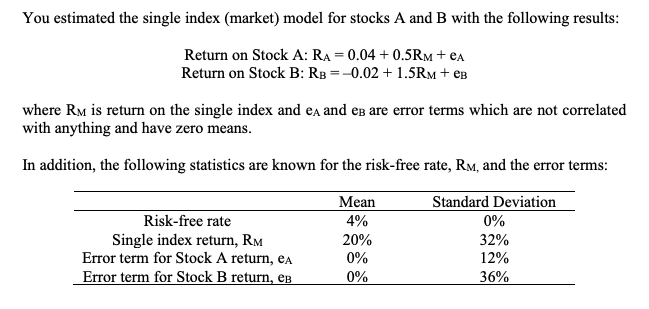
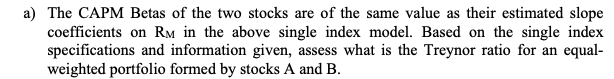
You estimated the single index (market) model for stocks A and B with the following results: Return on Stock A: RA = 0.04 + 0.5RM + eA Return on Stock B: RB = -0.02 + 1.5RM + eB where RM is return on the single index and ex and es are error terms which are not correlated with anything and have zero means. In addition, the following statistics are known for the risk-free rate, RM, and the error terms: Mean Standard Deviation Risk-free rate 4% 0% Single index return, RM 20% 32% Error term for Stock A return, eA 0% 12% Error term for Stock B return, eB 0% 36%a) The CAPM Betas of the two stocks are of the same value as their estimated slope coefficients on RM in the above single index model. Based on the single index specifications and information given, assess what is the Treynor ratio for an equal- weighted portfolio formed by stocks A and B
Step by Step Solution
There are 3 Steps involved in it

Get step-by-step solutions from verified subject matter experts