Question: Show all your work. 2. To what extent does ATTIME2 (a students' attitude towards statistics at time 2), TEST2 (percentage score on the midterm test),
Show all your work.
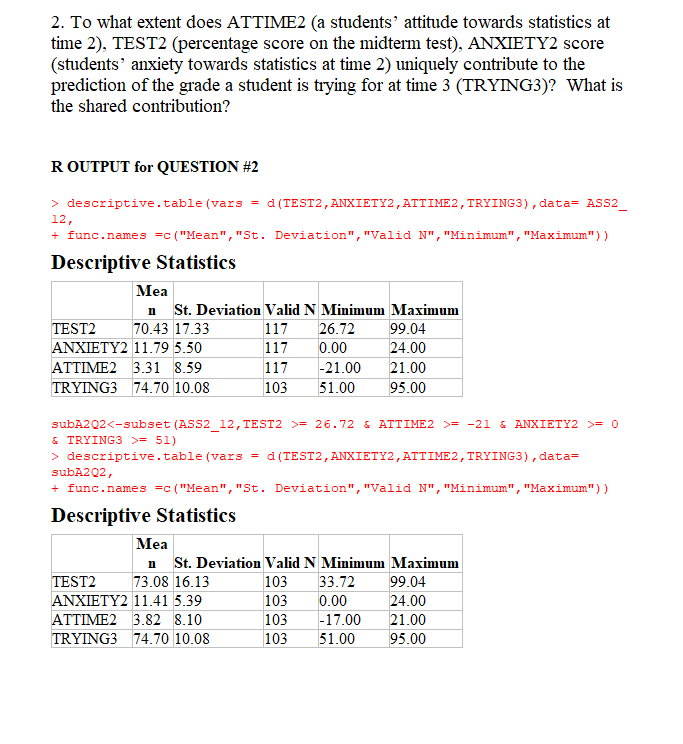
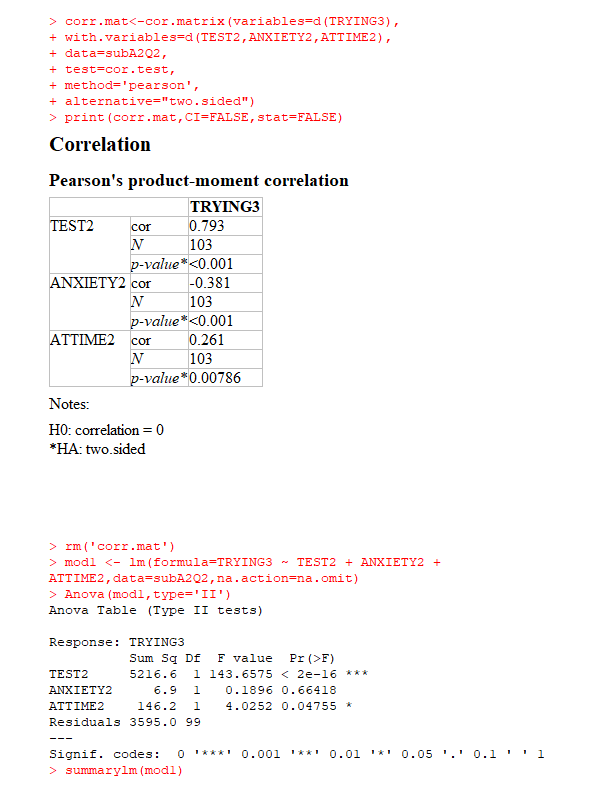
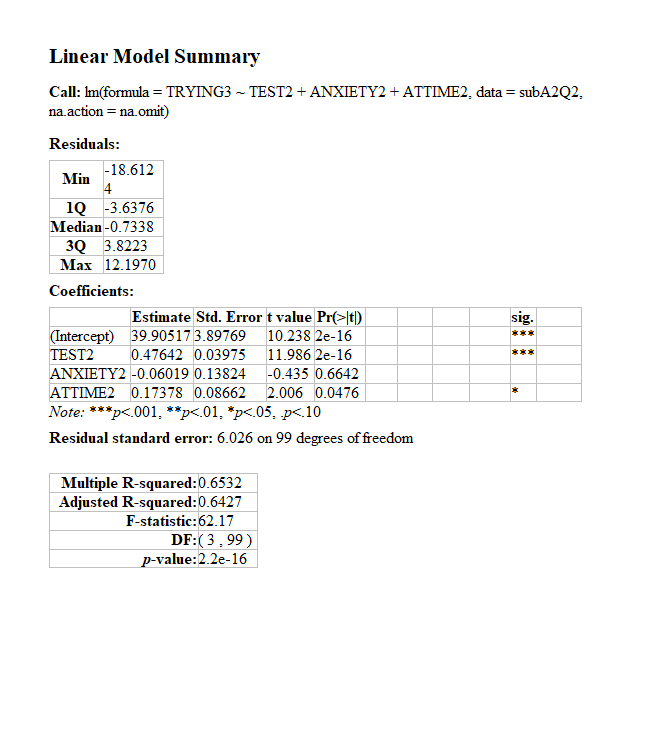
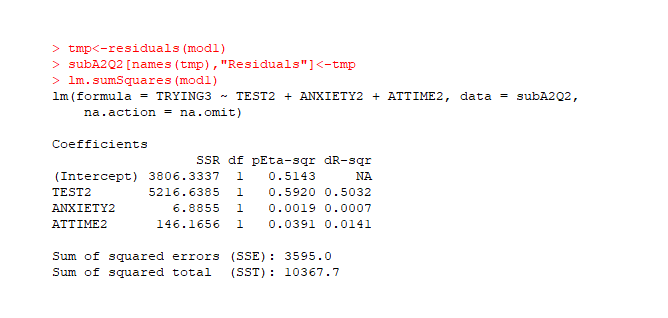
2. To what extent does ATTIME2 (a students' attitude towards statistics at time 2), TEST2 (percentage score on the midterm test), ANXIETY2 score (students' anxiety towards statistics at time 2) uniquely contribute to the prediction of the grade a student is trying for at time 3 (TRYING3)? What is the shared contribution? ROUTPUT for QUESTION #2 > descriptive.table (vars = d(TEST2, ANXIETY2, ATTIME2, TRYING3), data= ASS2_ 12, + func.names =c("Mean", "St. Deviation","Valid N", "Minimum", "Maximum")) Descriptive Statistics Mea n St. Deviation Valid N Minimum Maximum TEST2 70.43 17.33 117 26.72 99.04 ANXIETY2 11.79 5.50 117 0.00 24.00 ATTIME2 3.31 8.59 117 -21.00 21.00 TRYING3 74.70 10.08 103 51.00 95.00 subA2Q2= 26.72 & ATTIME2 >= -21 & ANXIETY2 >= 0 & TRYING3 >= 51) > descriptive.table (vars = d (TEST2, ANXIETY2, ATTIME2, TRYING3), data= subA202, + func.names =c("Mean", "St. Deviation","Valid N", "Minimum", "Maximum")) Descriptive Statistics Mea n St. Deviation Valid N Minimum Maximum TEST2 73.08 16.13 103 33.72 99.04 ANXIETY2 11.41 5.39 103 0.00 24.00 ATTIME2 3.82 8.10 -17.00 21.00 TRYING3 74.70 10.08 103 51.00 95.00 103 > corr.mat print (corr.mat, CI=FALSE, stat=FALSE) Correlation Pearson's product-moment correlation TRYING3 TEST2 cor 0.793 N 103 p-value* rm ('corr.mat') > modl Anova (modi, type='II') Anova Table (Type II tests) Response: TRYING3 Sum Sq DE F value Pr (>F) TEST2 5216.6 1 143.6575 summarylm (modl) Linear Model Summary Call: Im(formula = TRYING3 - TEST2 + ANXIETY2 + ATTIME2, data = subA2Q2. na.action = na.omit) Residuals: -18.612 Min 4 1Q-3.6376 Median -0.7338 3Q 3.8223 Max 12.1970 Coefficients: Estimate Std. Error t value Pr(>lt) sig. (Intercept) 39.905173.89769 10.238 2e-16 TEST2 0.47642 0.03975 11.986 2e-16 ANXIETY2 -0.06019 0.13824 -0.435 0.6642 ATTIME2 0.17378 0.08662 2.006 0.0476 Note: ***p<.001 p residual standard error: on degrees of freedom multiple r-squared:0.6532 adjusted r-squared:0.6427 f-statistic:62.17 df: p-value:> tmp subA2Q2 [names (tmp), "Residuals"] Im.sumSquares (modl) lm (formula = TRYING3 - TEST2 + ANXIETY2 + ATTIME2, data = subA202, na.action = na.omit) Coefficients SSR df pEta-sqr dR-sqr (Intercept) 3806.3337 1 0.5143 NA TEST2 5216.6385 1 0.5920 0.5032 ANXIETY2 6.8855 1 0.0019 0.0007 ATTIME2 146.1656 1 0.0391 0.0141 Sum of squared errors (SSE): 3595.0 Sum of squared total (SST): 10367.7 2. To what extent does ATTIME2 (a students' attitude towards statistics at time 2), TEST2 (percentage score on the midterm test), ANXIETY2 score (students' anxiety towards statistics at time 2) uniquely contribute to the prediction of the grade a student is trying for at time 3 (TRYING3)? What is the shared contribution? ROUTPUT for QUESTION #2 > descriptive.table (vars = d(TEST2, ANXIETY2, ATTIME2, TRYING3), data= ASS2_ 12, + func.names =c("Mean", "St. Deviation","Valid N", "Minimum", "Maximum")) Descriptive Statistics Mea n St. Deviation Valid N Minimum Maximum TEST2 70.43 17.33 117 26.72 99.04 ANXIETY2 11.79 5.50 117 0.00 24.00 ATTIME2 3.31 8.59 117 -21.00 21.00 TRYING3 74.70 10.08 103 51.00 95.00 subA2Q2= 26.72 & ATTIME2 >= -21 & ANXIETY2 >= 0 & TRYING3 >= 51) > descriptive.table (vars = d (TEST2, ANXIETY2, ATTIME2, TRYING3), data= subA202, + func.names =c("Mean", "St. Deviation","Valid N", "Minimum", "Maximum")) Descriptive Statistics Mea n St. Deviation Valid N Minimum Maximum TEST2 73.08 16.13 103 33.72 99.04 ANXIETY2 11.41 5.39 103 0.00 24.00 ATTIME2 3.82 8.10 -17.00 21.00 TRYING3 74.70 10.08 103 51.00 95.00 103 > corr.mat print (corr.mat, CI=FALSE, stat=FALSE) Correlation Pearson's product-moment correlation TRYING3 TEST2 cor 0.793 N 103 p-value* rm ('corr.mat') > modl Anova (modi, type='II') Anova Table (Type II tests) Response: TRYING3 Sum Sq DE F value Pr (>F) TEST2 5216.6 1 143.6575 summarylm (modl) Linear Model Summary Call: Im(formula = TRYING3 - TEST2 + ANXIETY2 + ATTIME2, data = subA2Q2. na.action = na.omit) Residuals: -18.612 Min 4 1Q-3.6376 Median -0.7338 3Q 3.8223 Max 12.1970 Coefficients: Estimate Std. Error t value Pr(>lt) sig. (Intercept) 39.905173.89769 10.238 2e-16 TEST2 0.47642 0.03975 11.986 2e-16 ANXIETY2 -0.06019 0.13824 -0.435 0.6642 ATTIME2 0.17378 0.08662 2.006 0.0476 Note: ***p<.001 p residual standard error: on degrees of freedom multiple r-squared:0.6532 adjusted r-squared:0.6427 f-statistic:62.17 df: p-value:> tmp subA2Q2 [names (tmp), "Residuals"] Im.sumSquares (modl) lm (formula = TRYING3 - TEST2 + ANXIETY2 + ATTIME2, data = subA202, na.action = na.omit) Coefficients SSR df pEta-sqr dR-sqr (Intercept) 3806.3337 1 0.5143 NA TEST2 5216.6385 1 0.5920 0.5032 ANXIETY2 6.8855 1 0.0019 0.0007 ATTIME2 146.1656 1 0.0391 0.0141 Sum of squared errors (SSE): 3595.0 Sum of squared total (SST): 10367.7


