

Question: Show calculations 1 NOTE: Cells/prompts for calculating ratios are located below the financial statements. 2 Supply answers in the cells that are shaded in pink.
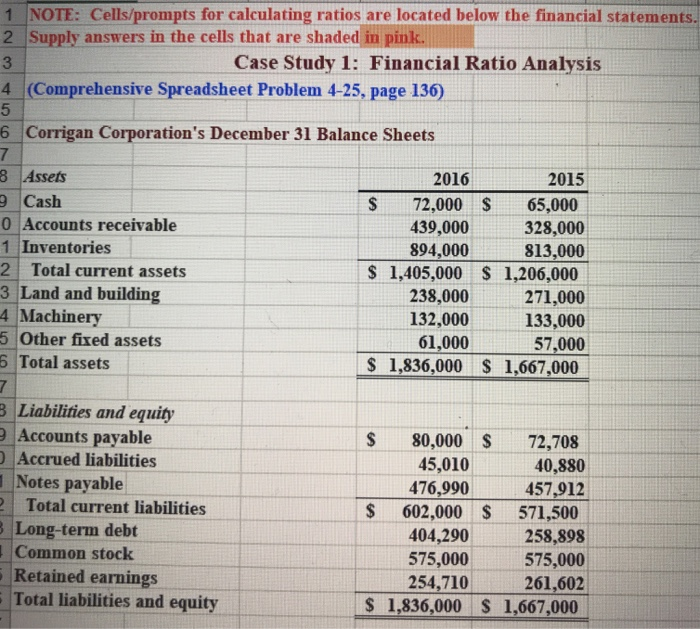
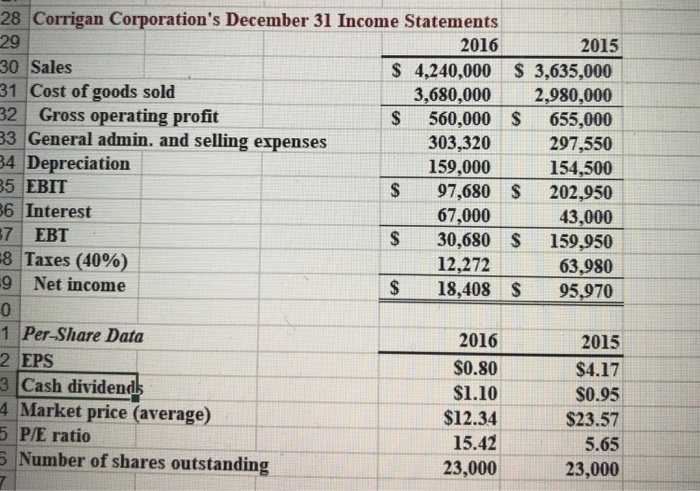
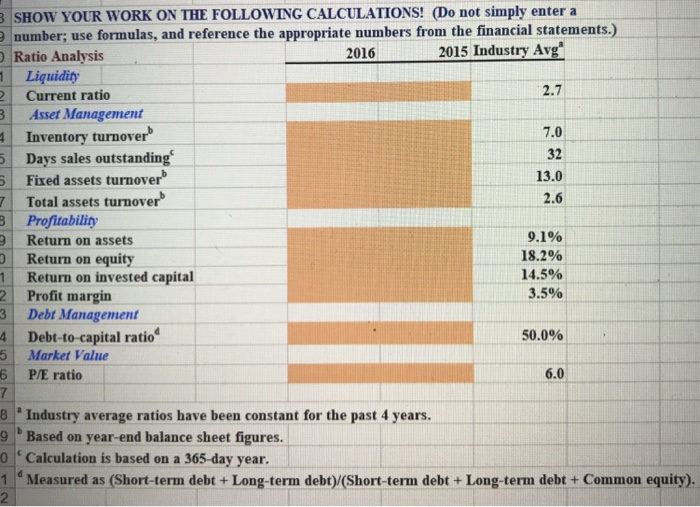
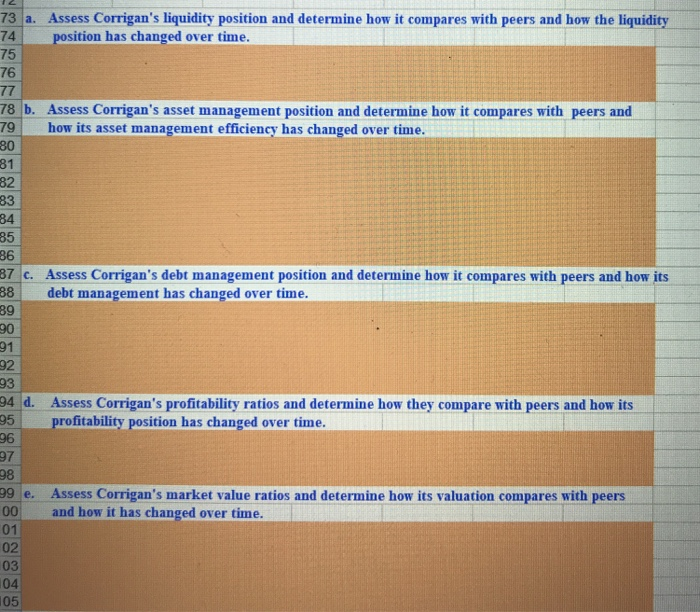
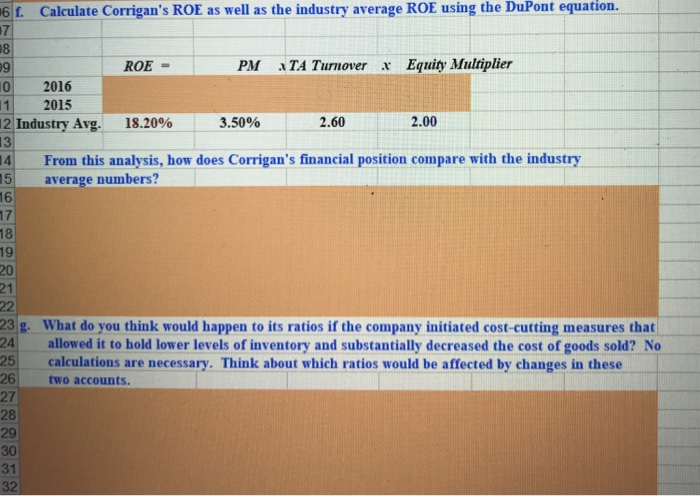
1 NOTE: Cells/prompts for calculating ratios are located below the financial statements. 2 Supply answers in the cells that are shaded in pink. 3 Case Study 1: Financial Ratio Analysis 4 (Comprehensive Spreadsheet Problem 4-25, page 136) 6 Corrigan Corporation's December 31 Balance Sheets 8 Assets 9 Cash 0 Accounts receivable 1 Inventories 2 Total current assets 3 Land and building 4 Machinery 5 Other fixed assets 6 Total assets 2015 S72,000 S65,000 328,000 813,000 S 1,405,000 S 1,206,000 271,000 132,000 133,000 57,000 S 1,836,000 S 1,667,000 2016 439,000 894,000 238,000 61,000 3Liabilities and equity Accounts payable Accrued liabilities Notes payable Total current liabilities Long-term debt Common stock Retained earnings Total liabilities and equity S 80,000 S 72,708 40,880 476,990457,912 S 602,000 S 571,500 258,898 575,000 254,710261,602 S 1,836,000 S 1,667,000 45,010 404,290 575,000 28 Corrigan Corporation's December 31 Income Statements 29 30 Sales 31 Cost of goods sold 2 Gross operating profit 3 General admin. and selling expenses 4 Depreciation 5 EBIT 6 Interest 7EBT 2015 S 4,240,000 S3,635,000 3,680,000 2,980,000 S 560,000 S655,000 303,320297,550 154,500 S 97,680 S 202,950 43,000 S 30,680 S 159,950 63,980 S18,408 S 95,970 2016 159,000 67,000 12,272 Taxes (40%) 9 Net income 1 Per-Share Data 2 EPS 2016 S0.80 S1.10 $12.34 15.42 23,000 2015 $4.17 S0.95 S23.57 5.65 23,000 3 Cash dividends 4 Market price (average) 5 P/E ratio Number of shares outstanding 81 SHOW YOUR wORK ON THE FOLLOWING CALCULATIONS! (Do not simply enter a number; use formulas, and reference the appropriate numbers from the financial statements.) Ratio Analysis 2016 2015 Industry Avg Liquidit Current ratio 2.7 3 Asset Management Inventory turnover 5 Days sales outstanding 5 Fixed assets turnover 7 Total assets turnover 7.0 32 13.0 2.6 Profitability 9.1% 18.2% 14.5% 3.596 Return on assets Return on invested capital 2 Profit margin 3 Debt Management 4 Debt-to-capital ratio 5 Market Value 6 P/E ratio 50.0% 6.0 8 Industry average ratios have been constant for the past 4 years. 9 Based on year-end balance sheet figures 0 Calculation is based on a 365-day year. 1 "Measured as (Short-term debt + Long-term debt)/(Short-term debt + Long-term debt + Common equity). Assess Corrigan's liquidity position and determine how it compares with peers and how the liquidity 73 a. 74 75 76 sition has changed over time. 78 b. Assess Corrigan's asset management position and determine how it compares with peers and 79 how its asset management efficiency has changed over time. 80 81 82 83 84 85 86 87 c. Assess Corrigan's debt management position and determine how it compares with peers and how its 88 debt management has changed over time. 89 91 93 94 d. Assess Corrigan's profitability ratios and determine how they compare with peers and how its 95 profitability position has changed over time. 96 97 98 99 e. Assess Corrigan's market value ratios and determine how its valuation compares with peers 00 and how it has changed over time. 01 02 03 04 05 6f. Calculate Corrigan's ROE as well as the industry average ROE using the DuPont equation. 7 8 9 0 2016 12015 2|Industry Avg. 18.20% 3.50% 13 14 From this analysis, how does Corrigan's financial position compare with the industry 5 average numbers? 16 ROE PM TA Turnover Equity Multiplier 2.60 2.00 18 19 20 21 23g. What do you think would happen to its ratios if the company initiated cost-cutting measures that 24 allowed it to hold lower levels of inventory and substantially decreased the cost of goods sold? No 25 calculations are necessary. Think about which ratios would be affected by changes in these 26 two accounts. 27 28 29 30 31 32
Step by Step Solution
There are 3 Steps involved in it

Get step-by-step solutions from verified subject matter experts