

Question: show excel formulas thanks Consider the following demand pattern for a product for the past 50 weeks. Compute the probabilities and the cumulative probabilities. Rewrite
show excel formulas thanks
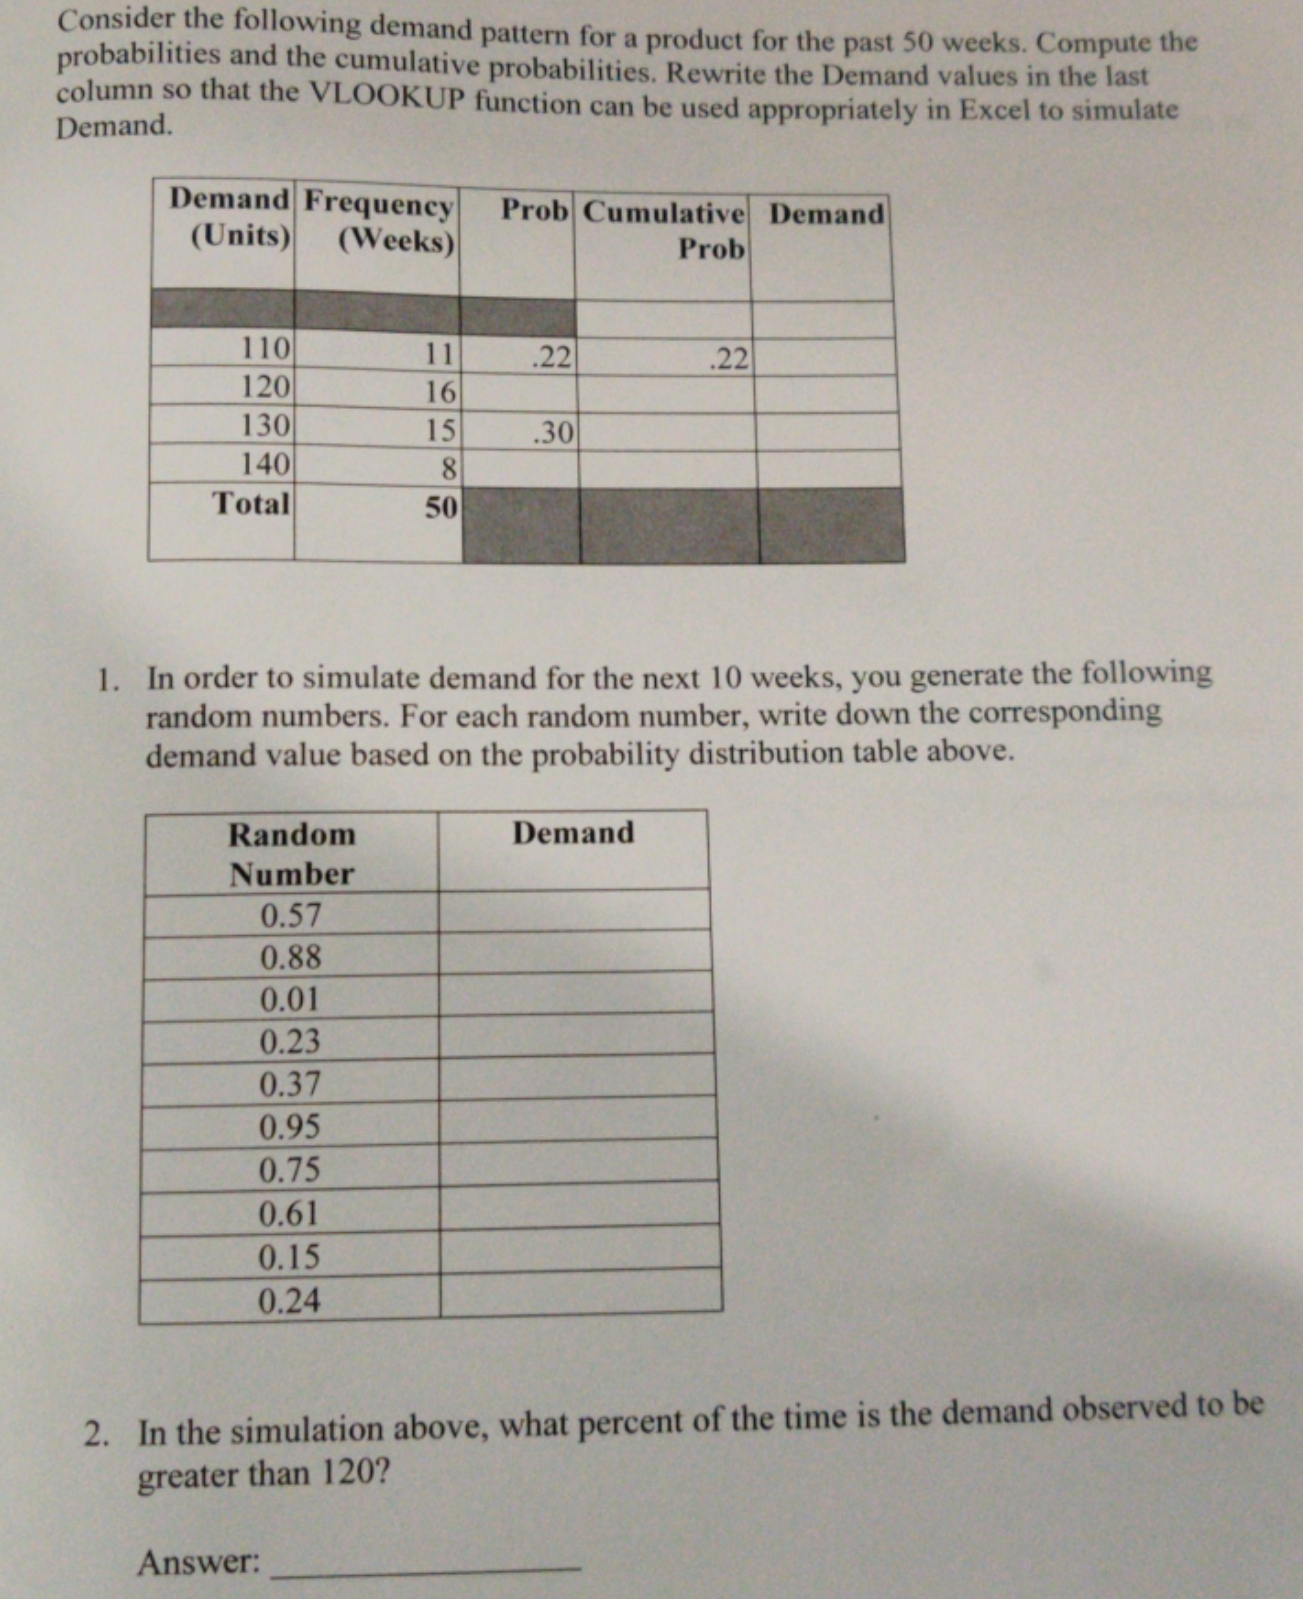
Consider the following demand pattern for a product for the past 50 weeks. Compute the probabilities and the cumulative probabilities. Rewrite the Demand values in the last Demand. column so that the VLOOKUP function can be used appropriately in Excel to simulate Demand Frequency (Units) Prob Cumulative Demand (Weeks) Prob 110 11 .22 .22 120 16 130 15 .30 140 8 Total 50 1. In order to simulate demand for the next 10 weeks, you generate the following random numbers. For each random number, write down the corresponding demand value based on the probability distribution table above. Random Demand Number 0.57 0.88 0.01 0.23 0.37 0.95 0.75 0.61 0.15 0.24 2. In the simulation above, what percent of the time is the demand observed to be greater than 120
Step by Step Solution
There are 3 Steps involved in it

Get step-by-step solutions from verified subject matter experts