

Question: Show formula and calculation Example 3.10: SPSS Output The following table is the result obtained from a study done on 25 respondents. Mean Statistic Std.
Show formula and calculation
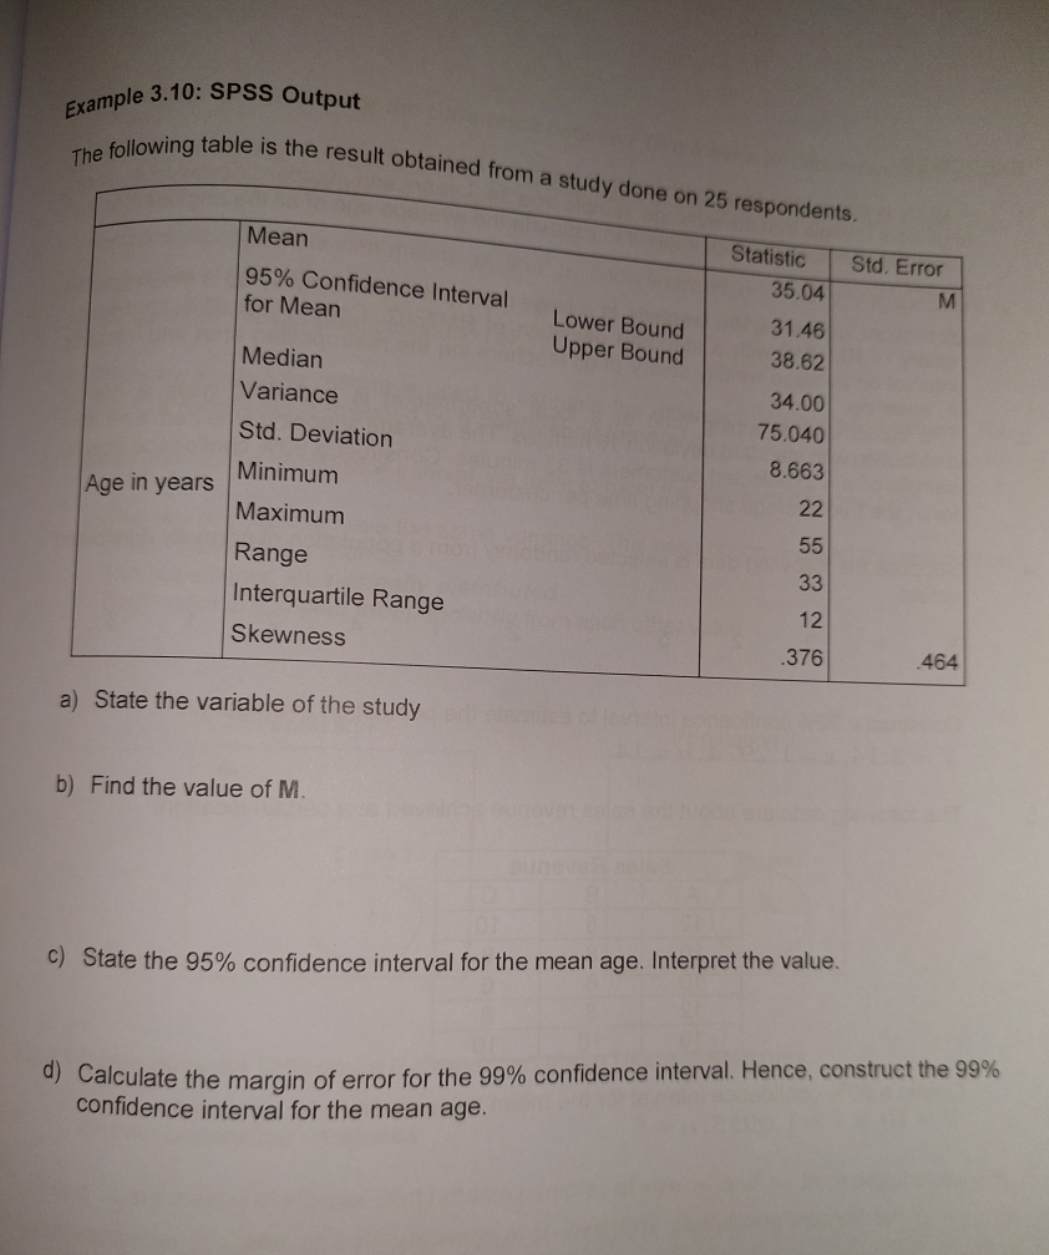
Example 3.10: SPSS Output The following table is the result obtained from a study done on 25 respondents. Mean Statistic Std. Error 35.04 95% Confidence Interval M for Mean Lower Bound 31.46 Upper Bound 38.62 Median 34.00 Variance 75.040 Std. Deviation 8.663 Minimum Age in years 22 Maximum 55 Range 33 Interquartile Range 12 Skewness 376 464 a) State the variable of the study b) Find the value of M. c) State the 95% confidence interval for the mean age. Interpret the value. d) Calculate the margin of error for the 99% confidence interval. Hence, construct the 99% confidence interval for the mean age
Step by Step Solution
There are 3 Steps involved in it

Get step-by-step solutions from verified subject matter experts