

Question: Show how you can replicate these two graphs in excel 1,000 900 Price ($) 800- 700- 600 - 500 400 300- 200 100 Year Today
Show how you can replicate these two graphs in excel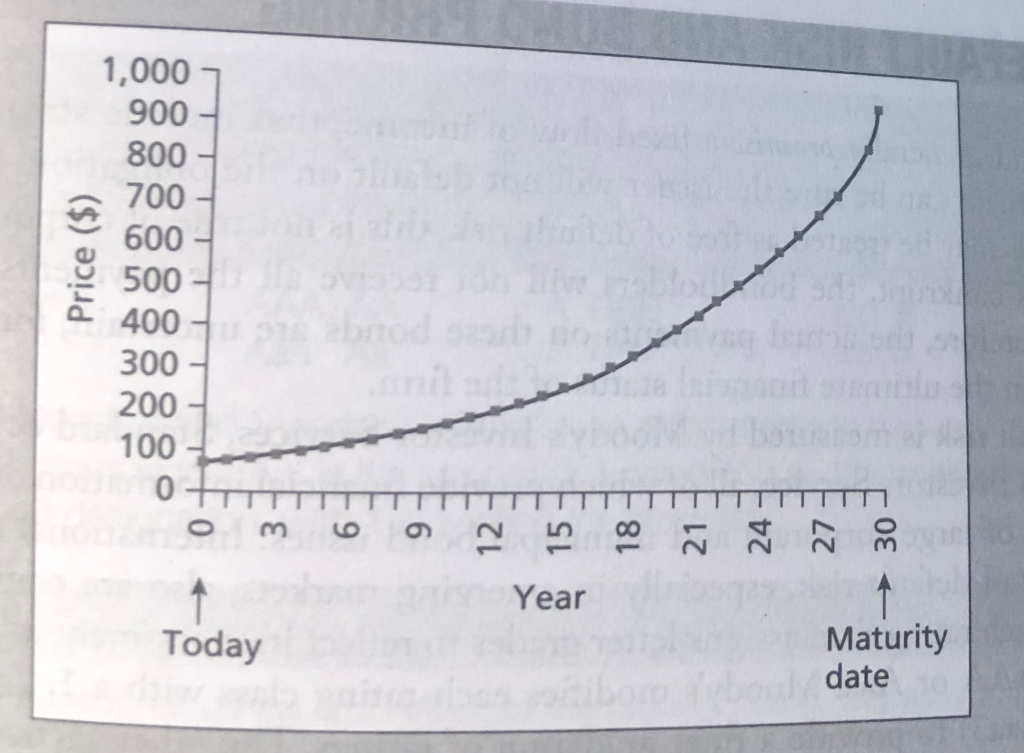
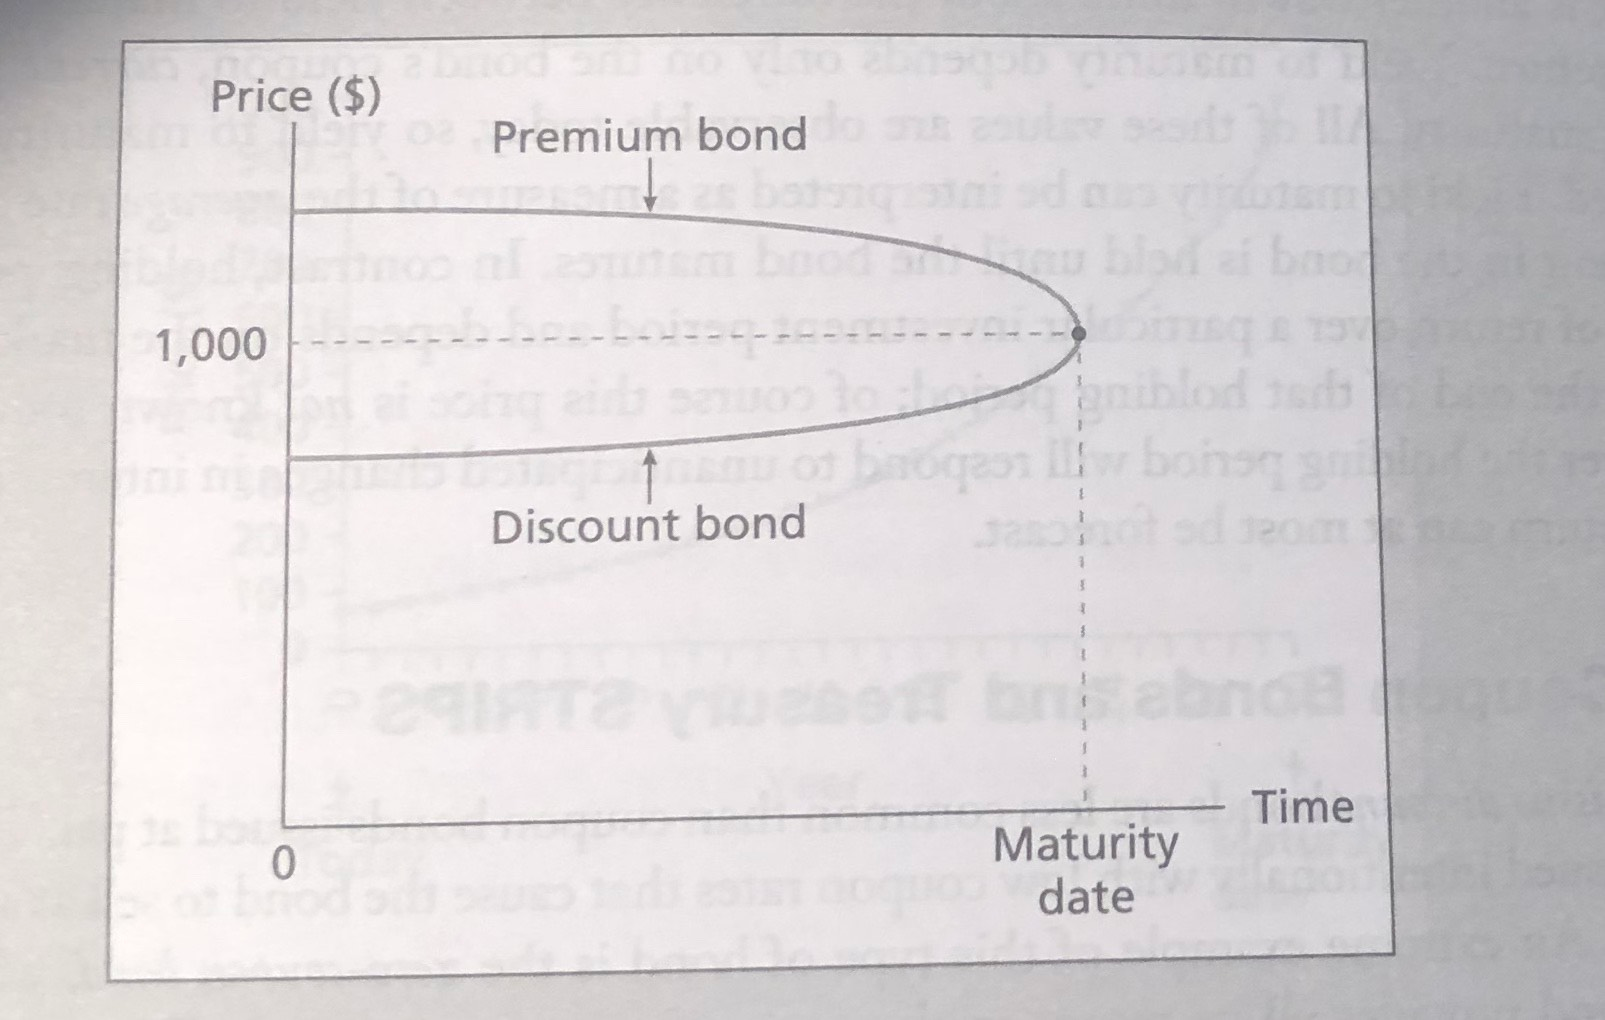
1,000 900 Price ($) 800- 700- 600 - 500 400 300- 200 100 Year Today Maturity date Price ($) Premium bond 1,000 Discount bond - Time Maturity date
Step by Step Solution
There are 3 Steps involved in it
1 Expert Approved Answer
Step: 1 Unlock

Question Has Been Solved by an Expert!
Get step-by-step solutions from verified subject matter experts
Step: 2 Unlock
Step: 3 Unlock