

Question: Show it in EXCEL. please explain what you put in excel tabs for formula Assuming ideal gas behavior, calculate and plot the density of carbon
Show it in EXCEL. please explain what you put in excel tabs for formula 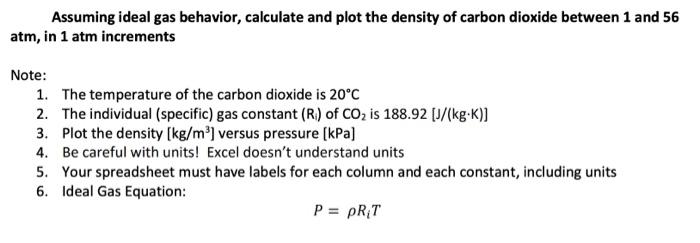
Assuming ideal gas behavior, calculate and plot the density of carbon dioxide between 1 and 56 atm, in 1 atm increments Note: 1. The temperature of the carbon dioxide is 20C 2. The individual (specific) gas constant (R) of CO2 is 188.92 [J/(kg.K)] 3. Plot the density (kg/m] versus pressure [kPa] 4. Be careful with units! Excel doesn't understand units 5. Your spreadsheet must have labels for each column and each constant, including units 6. Ideal Gas Equation: P = pRT
Step by Step Solution
There are 3 Steps involved in it
1 Expert Approved Answer
Step: 1 Unlock

Question Has Been Solved by an Expert!
Get step-by-step solutions from verified subject matter experts
Step: 2 Unlock
Step: 3 Unlock