

Question: show me how to do question 2, 4 in excel D G M Q Excel Assignment #1 Student Test #1 Instructions: aaa 354 You have
show me how to do question 2, 4 in excel
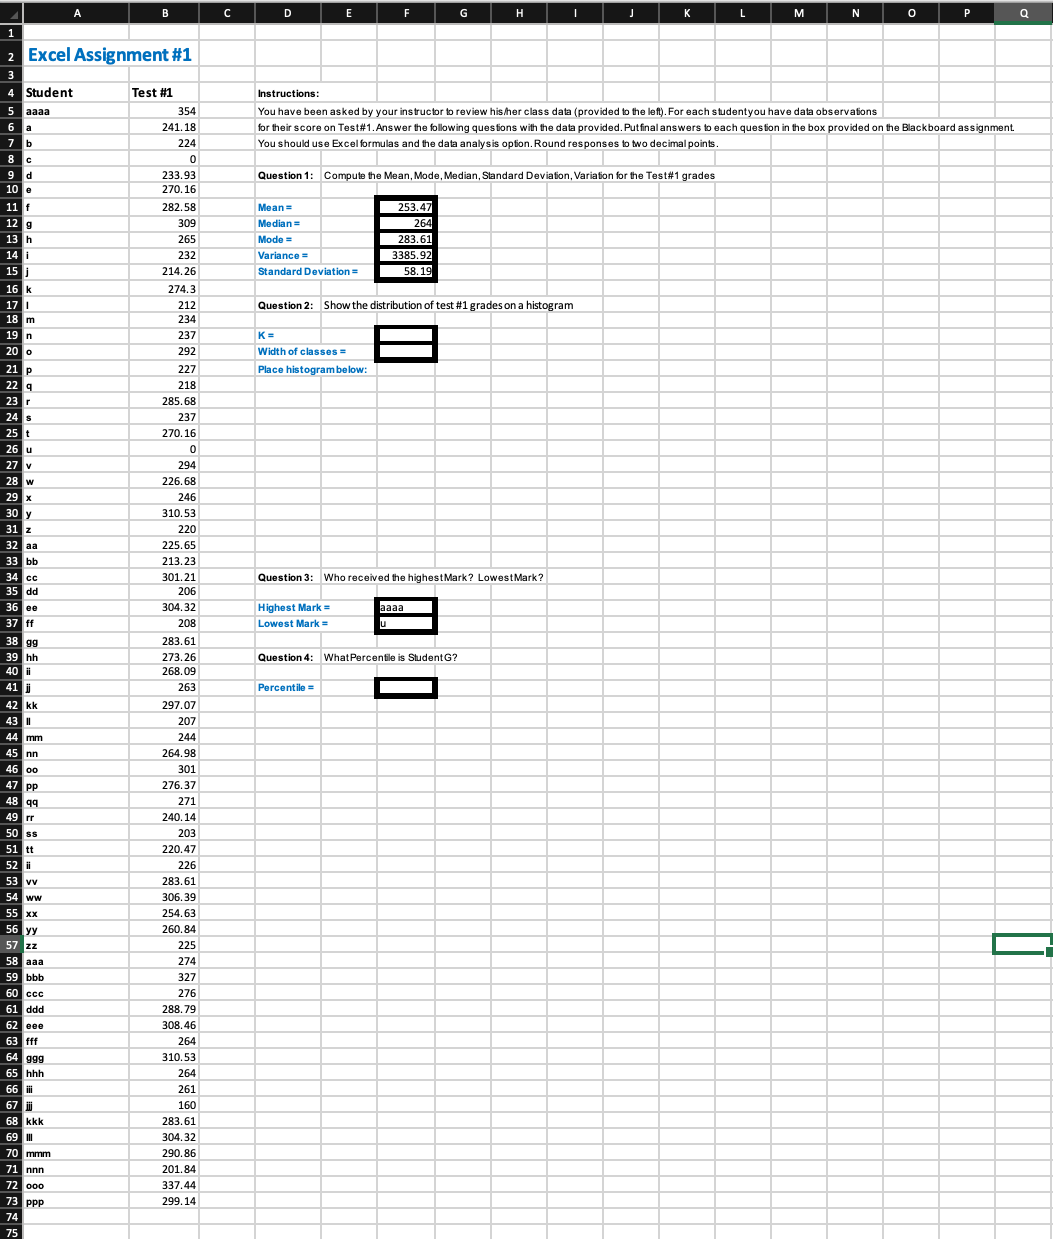
D G M Q Excel Assignment #1 Student Test #1 Instructions: aaa 354 You have been asked by your instructor to review his/her class data (provided to the left). For each studentyou have data observations 241. 18 for their score on Test#1. Answer the following questions with the data provided. Putfinal answers to each question in the box provided on the Blackboard assignment. 224 You should use Excel formulas and the data analysis option. Round responses to two decimal points 0 233.93 Question 1: Compute the Mean, Mode, Median, Standard Deviation, Variation for the Test#1 grades 270.16 282.58 Mean = 253.47 309 Median = 264 265 Mode = 283.61 232 Variance = 3385.92 214.26 Standard Deviation = 58 .19 274.3 212 Question 2: Show the distribution of test #1 grades on a histogram 234 237 292 Width of classes = 227 Place histogram below: 218 285.6 237 270.16 0 294 226.68 246 310.53 220 225.65 213.23 301.21 Question 3: Who received the highestMark? LowestMark? 206 304.32 Highest Mark = aaaa 208 Lowest Mark = 283.6 273.26 Question 4: What Percentile is StudentG? 268.0 263 Percentile 297.0 207 mm 244 264.98 301 276.37 271 240.14 203 220.47 226 283.6 306.39 254.63 260.8 225 274 327 276 288.79 308.4 264 999 310.53 hhh 264 261 160 KKK 283.61 304.37 mmm 290.8 non 201.84 12 000 337.44 ppp 299.14
Step by Step Solution
There are 3 Steps involved in it

Get step-by-step solutions from verified subject matter experts