

Question: g. Interpret the p-value in the context of the study. D If the success rate for the population of patients who receive the recommendation to
![ofthe surveyed med takers who lowered their cholesterol. C] If the success](https://dsd5zvtm8ll6.cloudfront.net/si.experts.images/questions/2024/10/6703edff3d2fa_7836703edff1a8a5.jpg)
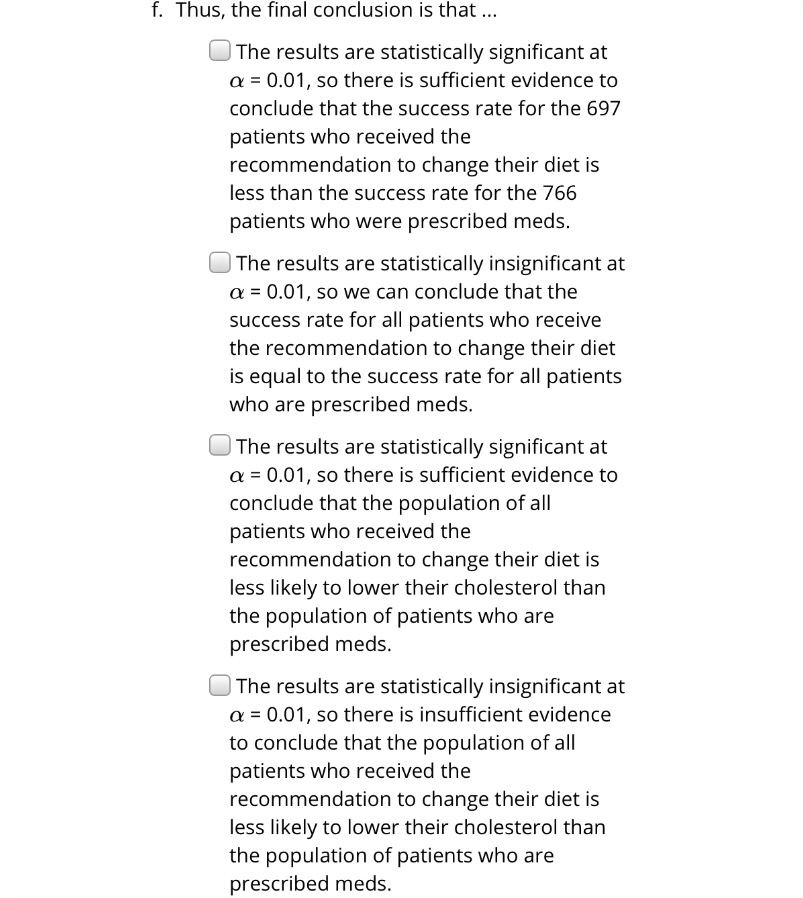
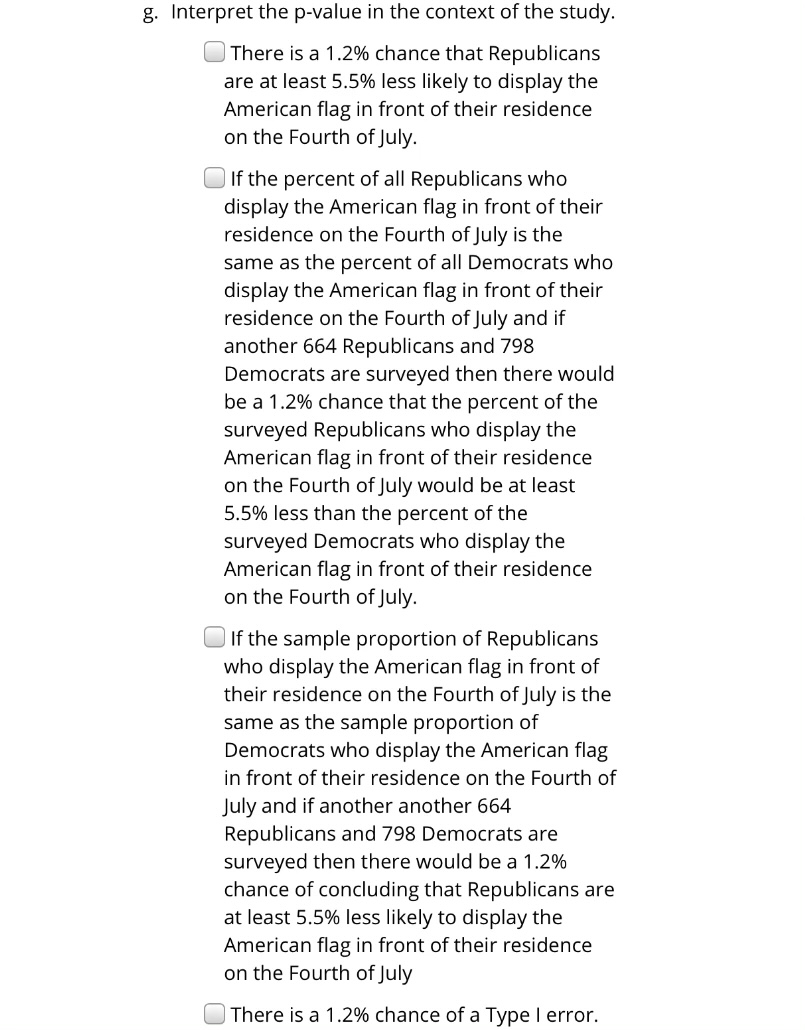
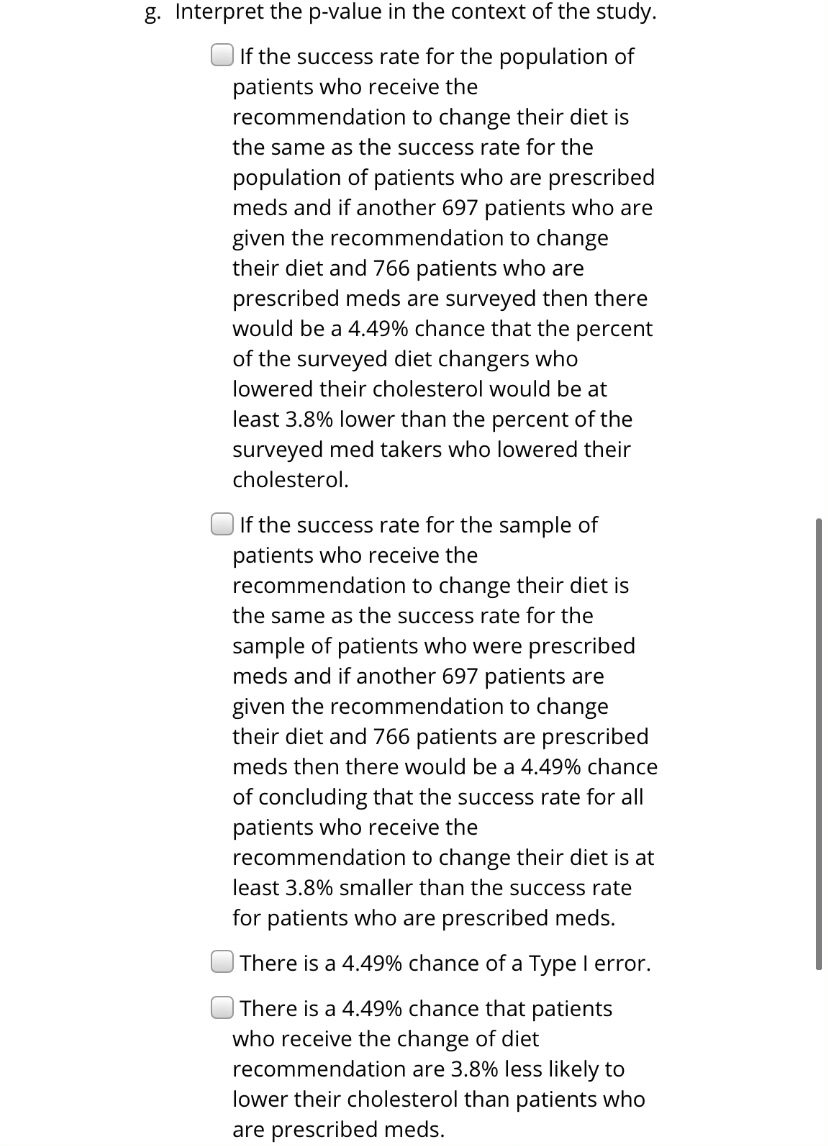
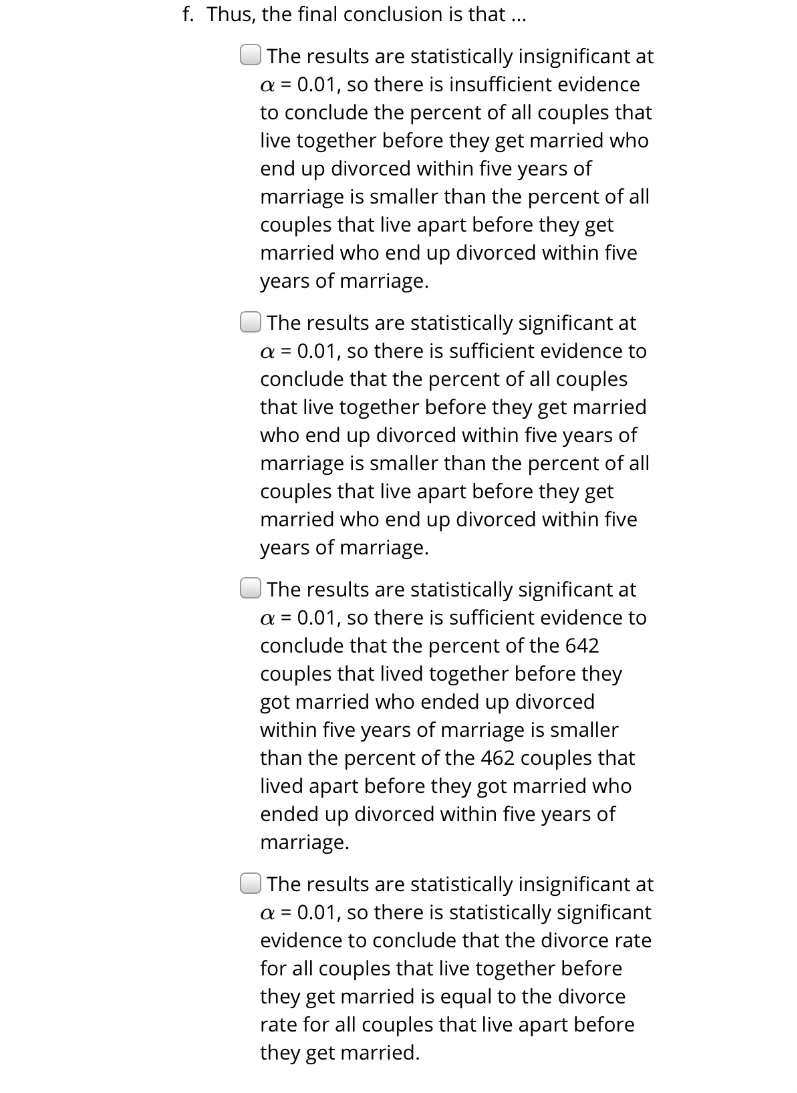
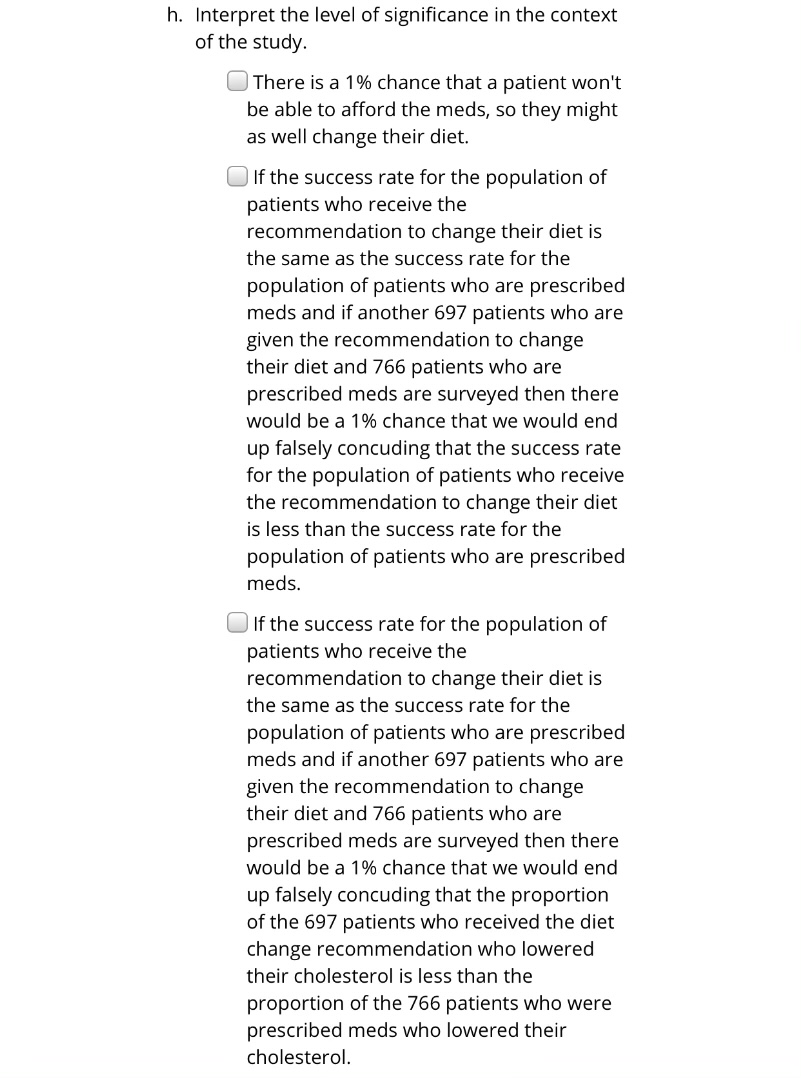
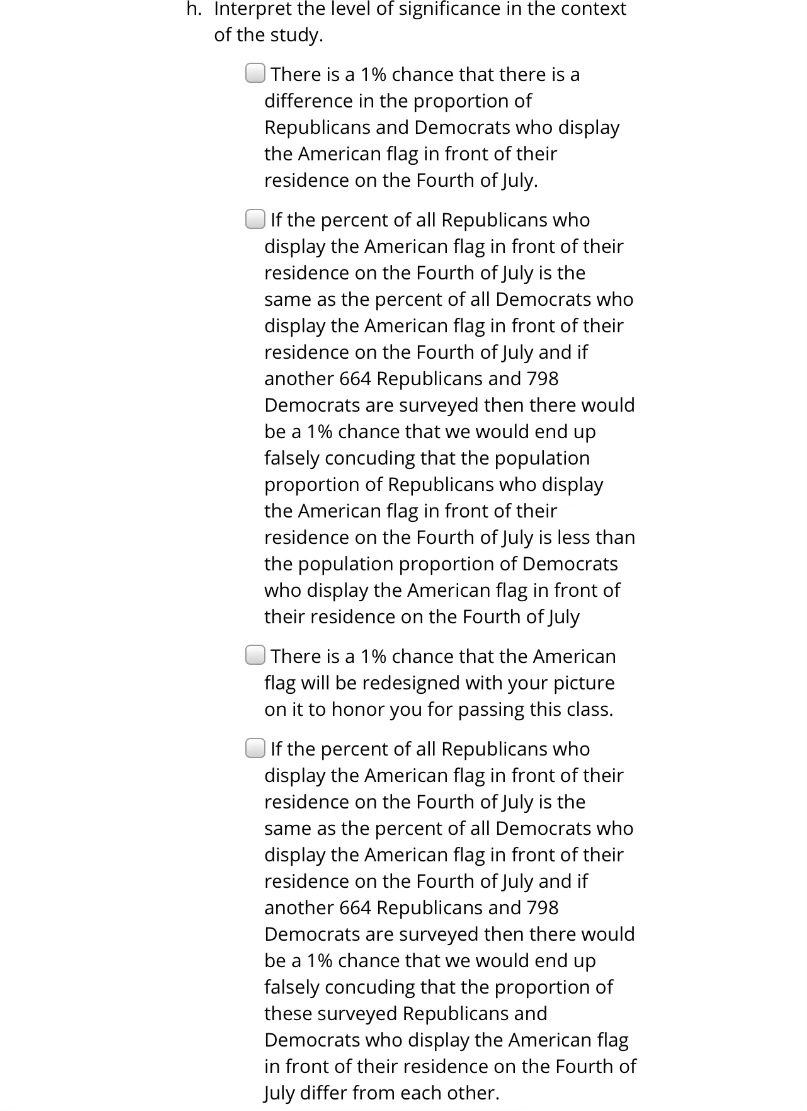
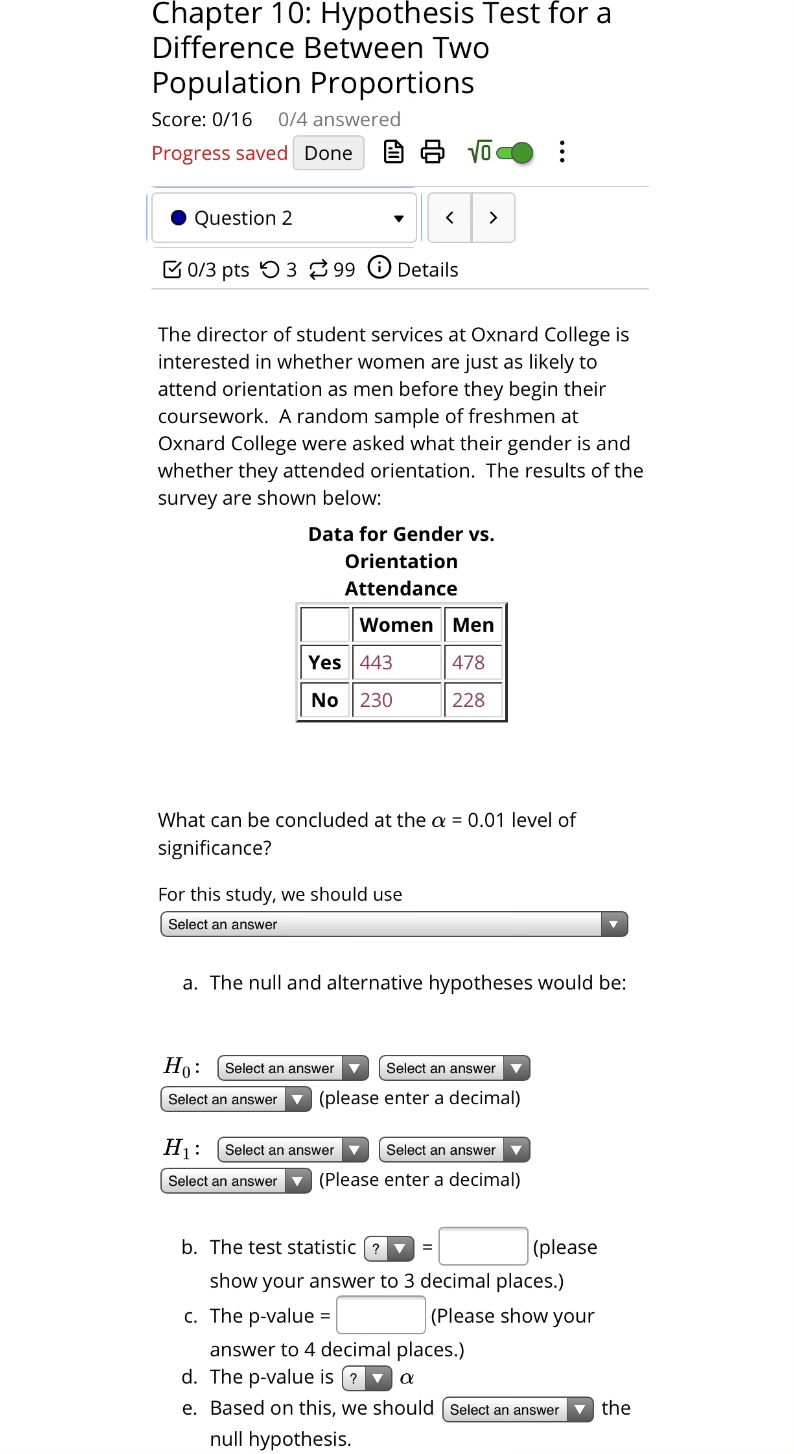
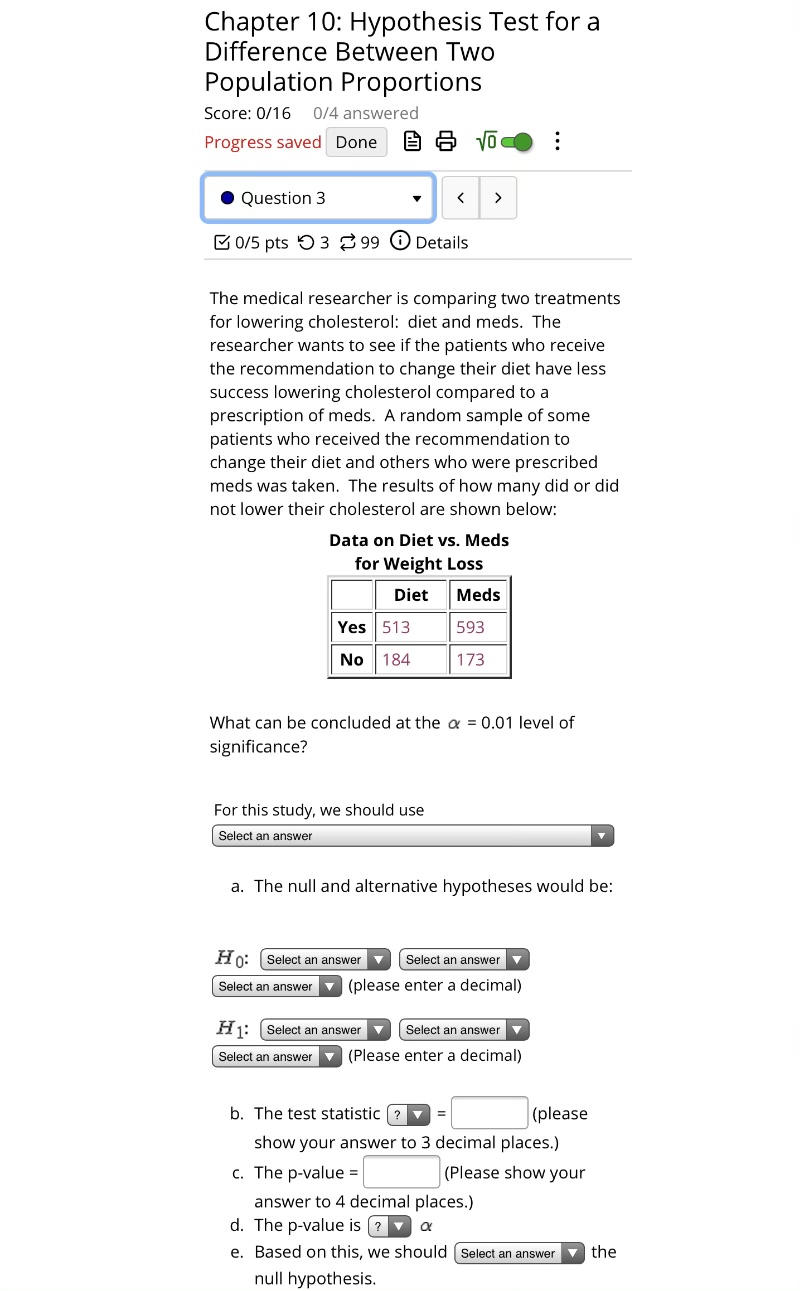
g. Interpret the p-value in the context of the study. D If the success rate for the population of patients who receive the recommendation to change their diet is the same as the success rate for the population of patients who are prescribed meds and if another 697 patients who are given the recommendation to change their diet and 766 patients who are prescribed meds are surveyed then there would be a 4.49% chance that the percent of the surveyed diet changers who lowered their cholesterol would be at least 3.8% lower than the percent ofthe surveyed med takers who lowered their cholesterol. C] If the success rate for the sample of patients who receive the recommendation to change their diet is the same as the success rate for the sample of patients who were prescribed meds and if another 697 patients are given the recommendation to change their diet and ?66 patients are prescribed meds then there would be a 4.49% chance of concluding that the success rate for all patients who receive the recommendation to change their diet is at least 3.8% smaller than the success rate for patients who are prescribed meds. C] There is a 4.49% chance of a Type I error. C] There is a 4.49% chance that patients who receive the change of diet recommendation are 3.8% less likely to lower their cholesterol than patients who are prescribed meds. . Thus, the nal conclusion is that [:1 The results are statistically insignificant at cc = 0.01, so there is insufcient evidence to conclude the percent of all couples that live together before they get married who end up divorced within ve years of marriage is smaller than the percent of all couples that live apart before they get married who end up divorced within five years of marriage. C] The results are statistically signicant at or = 0.01, so there is sufficient evidence to conclude that the percent of all couples that live together before they get married who end up divorced within five years of marriage is smaller than the percent of all couples that live apart before they get married who end up divorced within five years of marriage. C] The results are statistically signicant at or = 0.01, so there is sufficient evidence to conclude that the percent of the 642 couples that lived together before they got married who ended up divorced within five years of marriage is smaller than the percent of the 462 couples that lived apart before they got married who ended up divorced within five years of marriage. C] The results are statistically insignificant at or = 0.01, so there is statistically signicant evidence to conclude that the divorce rate for all couples that live together before they get married is equal to the divorce rate for all couples that live apart before they get married. h. Interpret the level of signicance in the context of the study. Q There is a 1% chance that a patient won't be able to afford the meds, so they might as well change their diet. C] If the success rate for the population of patients who receive the recommendation to change their diet is the same as the Success rate for the population of patients who are prescribed meds and if another 697 patients who are given the recommendation to change their diet and 7'66 patients who are prescribed meds are surveyed then there would be a 1% chance that we would end up falsely concuding that the success rate for the population of patients who receive the recommendation to change their diet is less than the success rate for the population of patients who are prescribed meds. C] If the success rate for the population of patients who receive the recommendation to change their diet is the same as the success rate for the population of patients who are prescribed meds and if another 697 patients who are given the recommendation to change their diet and Ti' patients who are prescribed meds are surveyed then there would be a 1% chance that we would end up falsely concuding that the proportion of the 69? patients who received the diet change recommendation who lowered their cholesterol is less than the proportion of the T66 patients who were prescribed meds who lowered their cholesterol. h. Interpret the level of significance in the context of the study. C] There is a 1% chance that there is a difference in the proportion of Republicans and Democrats who display the American flag in front of their residence on the Fourth ofJuly. C] If the percent of all Republicans who display the American flag in front of their residence on the Fourth ofJuly is the same as the percent of all Democrats who display the American flag in front of their residence on the Fourth ofJuly and if another 664 Republicans and 7'98 Democrats are surveyed then there would be a 1% chance that we would end up falsely concuding that the population proportion of Republicans who display the American flag in front of their residence on the Fourth ofJuly is less than the population proportion of Democrats who display the American flag in front of their residence on the Fourth ofJuly C] There is a 1% chance that the American flag will be redesigned with your picture on it to honor you for passing this class. C] If the percent of all Republicans who display the American flag in front of their residence on the Fourth ofJuly is the same as the percent of all Democrats who display the American flag in front of their residence on the Fourth ofJuly and if another 664 Republicans and T98 Democrats are surveyed then there would be a 1% chance that we would end up falsely concuding that the proportion of these surveyed Republicans and Democrats who display the American flag in front oftheir residence on the Fourth of July differ from each other. . Thus, the nal conclusion is that C] The results are statistically insignicant at o: = 0.01, so there is insufficient evidence to conclude that the population proportion of freshmen women at Oxnard College who attend orientation is different from the population proportion of freshmen men at Oxnard College who attend orientation. CI The results are statistically signicant at or = 0.01, so there is sufficient evidence to conclude that the population proportion of freshmen women at Oxnard College who attend orientation is different from the population proportion of freshmen men at Oxnard College who attend orientation. C] The results are statistically signicant at or = 0.01, so there is sufficient evidence to conclude that the proportion of the 673 freshmen women who attended orientation is different from the proportion of the 7'06 freshmen men who attended orientation. {3 The results are statistically insignicant at o: = 0.01, so there is statistically significant evidence to conclude that the population proportion of freshmen women at Oxnard College who attend orientation is the same as the population proportion of freshmen men at Oxnard College who attend orientation. Chapter 10: Hypothesis Test for a Difference Between Two Population Proportions Score: 0/16 0/4 answered Progress saved Done BE TOO . . . . Question 2 > 0/3 pts 9 3 99 0 Details The director of student services at Oxnard College is interested in whether women are just as likely to attend orientation as men before they begin their coursework. A random sample of freshmen at Oxnard College were asked what their gender is and whether they attended orientation. The results of the survey are shown below: Data for Gender vs. Orientation Attendance Women Men Yes 443 478 No 230 228 What can be concluded at the a = 0.01 level of significance? For this study, we should use Select an answer a. The null and alternative hypotheses would be: Ho: Select an answer V Select an answer V Select an answer v (please enter a decimal) H1 : Select an answer Select an answer Select an answer v (Please enter a decimal) b. The test statistic (? (please show your answer to 3 decimal places.) c. The p-value = (Please show your answer to 4 decimal places.) d. The p-value is ? v a e. Based on this, we should ( Select an answer V the null hypothesis.Chapter 10: Hypothesis Test for a Difference Between Two Population Proportions Score: 0.116 UM answered Progresssaved Done Q 115' E 0 Question 3 v Bars pts 03 399 @oetails The medical researcher is comparing two treatments for lowering cholesterol: diet and meds. The researcher wants to see if the patients who receive the recommendation to change their diet have less success lowering cholesterol compared to a prescription of meds. A random sample of some patients who received the recommendation to change their diet and others who were prescribed meds was taken. The results of how many did or did not lower their cholesterol are shown below: Data on Diet vs. Meals for Weight Loss WWW What can be concluded at the a = D.D1 level of signicance? For this study, we should use _ a. The null and alternative hypotheses would be: He: [please enter a decimal) so (Please enter a decimal) h. The test statistic = Siplease show your answer to 3 decimal places] c. The p-value = :l (Please show your answer to 4 decimal places.) d. The pvalue is ct e. Based on this. we should the null hypothesis. f. Thus, the final conclusion is that ... OThe results are statistically insignificant at a = 0.01, so there is insufficient evidence to conclude that the population proportion of Republicans who display the American flag in front of their residence on the Fourth of July is less than the population proportion of Democrats who display the American flag in front of their residence on the Fourth of July. OThe results are statistically insignificant at a = 0.01, so we can conclude that the population proportion of Republicans who display the American flag in front of their residence on the Fourth of July is equal to the population proportion of Democrats who display the American flag in front of their residence on the Fourth of July. The results are statistically significant at a = 0.01, so there is sufficient evidence to conclude that the proportion of the 664 Republicans who displayed the American flag in front of their residence on the Fourth of July is less than the proportion of the 798 Democrats who displayed the American flag in front of their residence on the Fourth of July. OThe results are statistically significant at a = 0.01, so there is sufficient evidence to conclude that the population proportion of Republicans who display the American flag in front of their residence on the Fourth of July is less than the population proportion of Democrats who display the American flag in front of their residence on the Fourth of July.Chapter 10: Hypothesis Test for a Difference Between Two Population Proportions Score: 0/16 0/4 answered Progress saved Done . . . . Question 1 0/3 pts 9 3 99 0 Details Are couples that live together before they get married less likely to end up divorced within five years of marriage compared to couples that live apart before they get married? 235 of the 642 couples from the study who lived together before they got married were divorced within five years of marriage. 177 of the 462 couples from the study who lived apart before they got married were divorced within five years of marriage. What can be concluded at the or = 0.01 level of significance? For this study, we should use Select an answer a. The null and alternative hypotheses would be: Ho: Select an answer V Select an answer Select an answer H1: Select an answer Select an answer Select an answer b. The test statistic (? (please show your answer to 3 decimal places.) c. The p-value = (Please show your answer to 4 decimal places.) d. The p-value is (? a e. Based on this, we should ( Select an answer V the null hypothesis.Chapter 10: Hypothesis Test for a Difference Between Two Population Proportions Score: 0/16 0/4 answered Progress saved Done B & Voce . . . . Question 4 0/5 pts O 3 99 0 Details Are Republicans less likely than Democrats to display the American flag in front of their residence on the Fourth of July? 437 of the 664 Republicans surveyed display the flag on the Fourth of July and 569 of the 798 Democrats surveyed display the flag on the Fourth of July. What can be concluded at the a = 0.01 level of significance? For this study, we should use Select an answer a. The null and alternative hypotheses would be: Ho: Select an answer V Select an answer V Select an answer v (please enter a decimal) H1 : Select an answer Select an answer V Select an answer (Please enter a decimal) b. The test statistic (? = (please show your answer to 3 decimal places.) c. The p-value = (Please show your answer to 4 decimal places.) d. The p-value is (? v a e. Based on this, we should | Select an answer the null hypothesis.. Thus, the final conclusion is that C] The results are statistically signicant at o: = 0.01, so there is sufcient evidence to conclude that the success rate for the 697 patients who received the recommendation to change their diet is less than the success rate for the 766 patients who were prescribed meds. C] The results are statistically insignicant at o: = 0.01, so we can conclude that the success rate for all patients who receive the recommendation to change their diet is equal to the success rate for all patients who are prescribed meds. D The results are statistically significant at o: = 0.01, so there is sufcient evidence to conclude that the population of all patients who received the recommendation to change their diet is less likely to lower their cholesterol than the population of patients who are prescribed meds. C] The results are statistically insignicant at o: = 0.01, so there is insufficient evidence to conclude that the population of all patients who received the recommendation to change their diet is less likely to lower their cholesterol than the population of patients who are prescribed meds. g. Interpret the p-yalue in the context of the study. C] There is a 1.2% chance that Republicans are at least 5.5% less likely to display the American ag in front of their residence on the Fourth ofjuly. C] If the percent of all Republicans who display the American flag in front of their residence on the Fourth ofJuly is the same as the percent of all Democrats who display the American flag in front of their residence on the Fourth ofJuly and if another 664 Republicans and 798 Democrats are surveyed then there would be a 1.2% chance that the percent of the surveyed Republicans who display the American ag in front of their residence on the Fourth ofJuly would be at least 5.5% less than the percent of the surveyed Democrats who display the American ag in front of their residence on the Fourth ofjuly. D If the sample proportion of Republicans who display the American flag in front of their residence on the Fourth ofJuly is the same as the sample proportion of Democrats who display the American flag in front of their residence on the Fourth of july and if another another 664 Republicans and 798 Democrats are surveyed then there would be a 1.2% chance of concluding that Republicans are at least 5.5% less likely to display the American ag in front of their residence on the Fourth ofJuly [3 There is a 1.2% chance of a Type I error
Step by Step Solution
There are 3 Steps involved in it

Get step-by-step solutions from verified subject matter experts