

Question: Show me the plots, don't just explain it . Using the data, create a polar pressure plot. It is recommended to plot pressure relative to
Show me the plots, don't just explain it
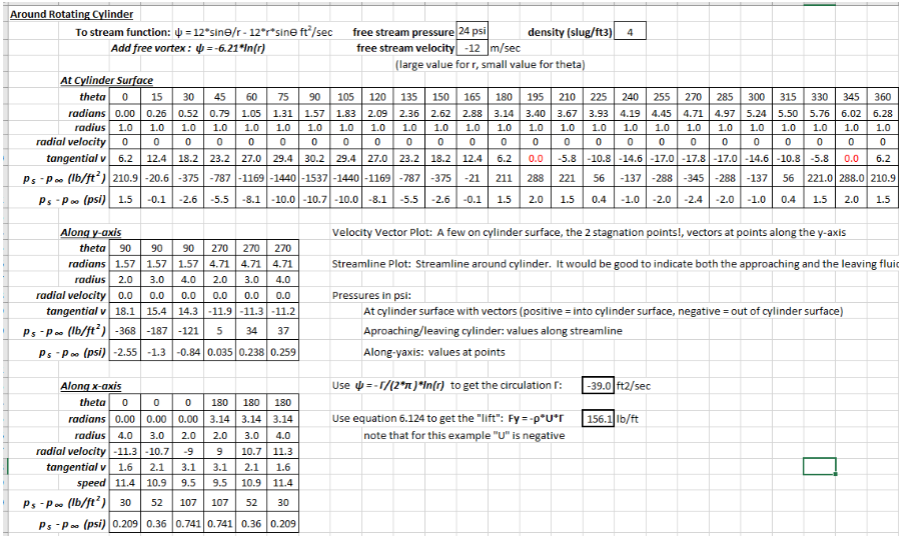
Using the data, create a polar pressure plot. It is recommended to plot pressure relative to ambient pressure. ie pspinfi
i At the cylinder surface, plot at least surface pressure vector pairs for example, at and Positive pressure into the cylinder surface.
ii Plot free stream velocity vectors both upstream and downstream from the cylinder. On at least of one of these vectors, indicate the relative pressure's numerical value.
iii Add an approximation of the streamline to the right stagnation point and from the left stagnation oint.
iv Show the numerical value of the fluid pressure at least points outside the cylinder.
v Indicate the cylinder rotation direction.
vi indicate the lift direction.
Step by Step Solution
There are 3 Steps involved in it
1 Expert Approved Answer
Step: 1 Unlock

Question Has Been Solved by an Expert!
Get step-by-step solutions from verified subject matter experts
Step: 2 Unlock
Step: 3 Unlock