

Question: Show me the steps to solve Data Processing ( 2 pts ) : Load the dataset into a Jupyter Notebook and explore the data for
Show me the steps to solve Data Processing pts:
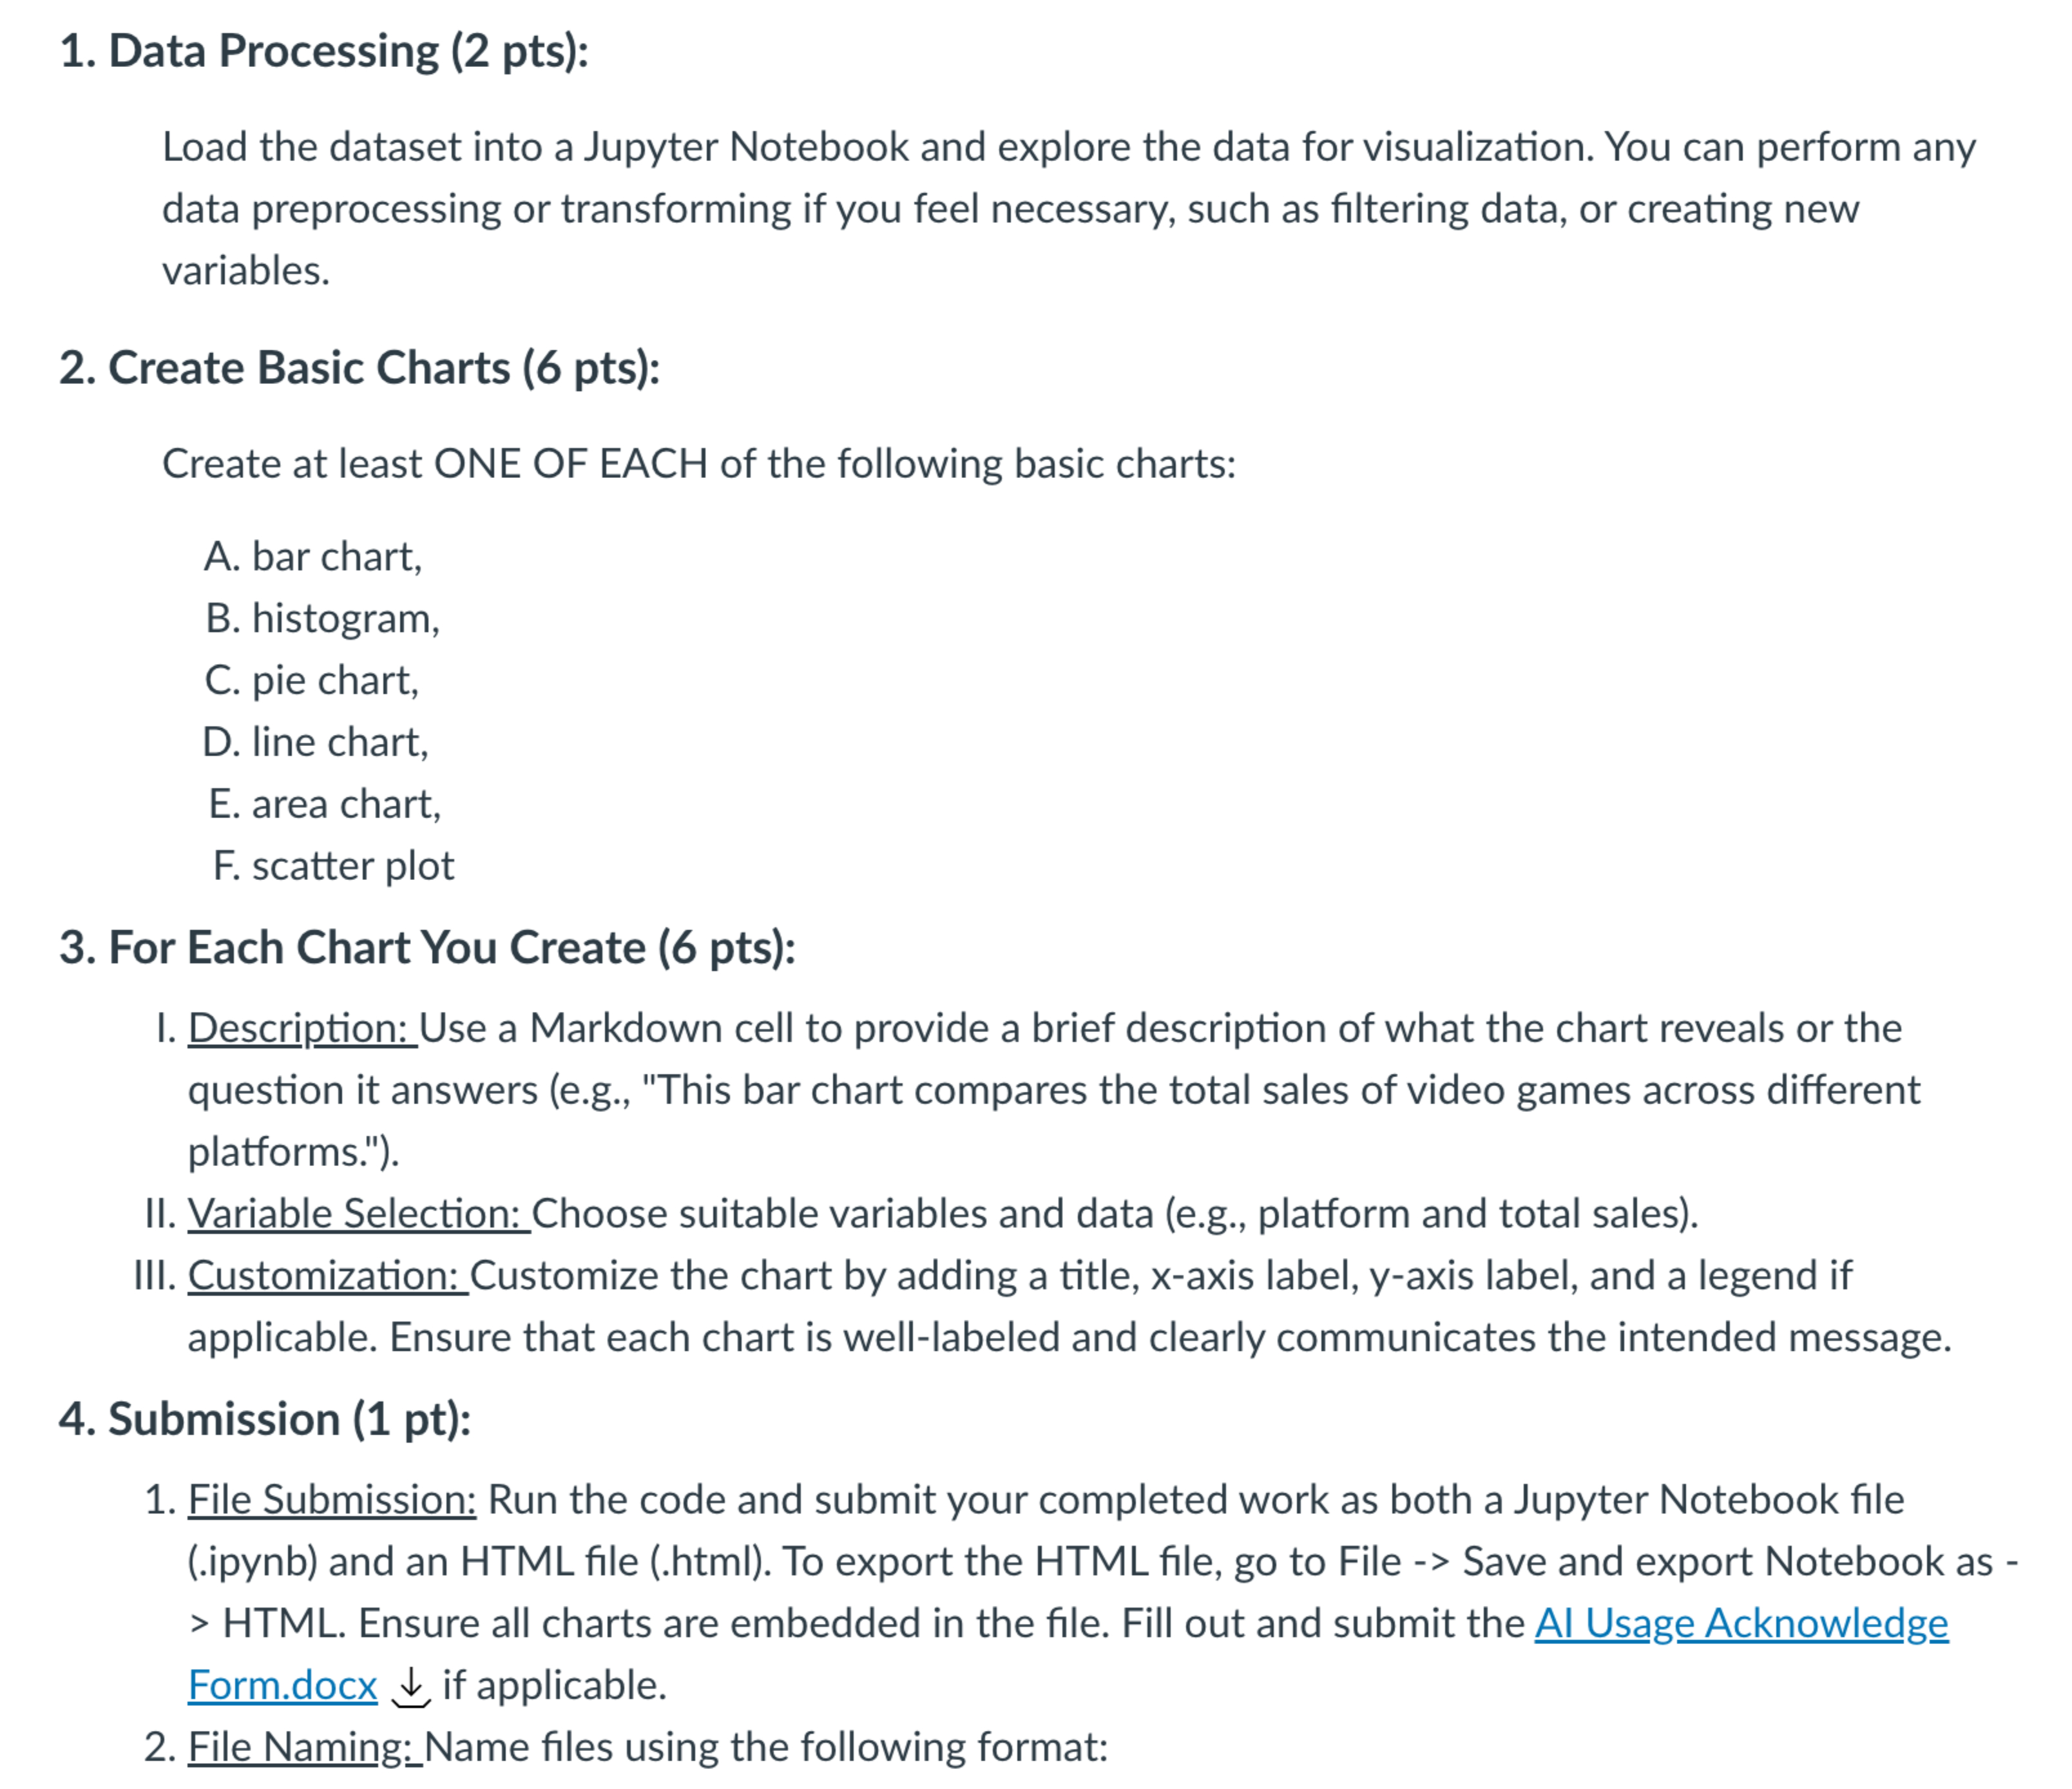
Load the dataset into a Jupyter Notebook and explore the data for visualization. You can perform any
data preprocessing or transforming if you feel necessary, such as filtering data, or creating new
variables.
Create Basic Charts pts:
Create at least ONE OF EACH of the following basic charts:
A bar chart,
B histogram,
C pie chart,
D line chart,
E area chart,
F scatter plot
For Each Chart You Create pts:
I. Description: Use a Markdown cell to provide a brief description of what the chart reveals or the
question it answers eg "This bar chart compares the total sales of video games across different
platforms."
II Variable Selection: Choose suitable variables and data eg platform and total sales
III. Customization: Customize the chart by adding a title, axis label, axis label, and a legend if
applicable. Ensure that each chart is welllabeled and clearly communicates the intended message.
Submission pt:
File Submission: Run the code and submit your completed work as both a Jupyter Notebook file
ipynb and an HTML file html To export the HTML file, go to File Save and export Notebook as Form.docx darr if applicable.
File Naming:Name files using the following format:
Step by Step Solution
There are 3 Steps involved in it
1 Expert Approved Answer
Step: 1 Unlock

Question Has Been Solved by an Expert!
Get step-by-step solutions from verified subject matter experts
Step: 2 Unlock
Step: 3 Unlock