

Question: Write Python code to solve this homework in detail with comments. eg of csv file contain: AREA Description AGR The course aims to introduce Rules
Write Python code to solve this homework in detail with comments.
eg of csv file contain:
| AREA | Description | |||||||||||||||||||||||||||||||||||||||||
| AGR | The course aims to introduce Rules and Regulations that are designated for undergraduate SQU students. The course will teach students strategies for self-end time management, how to be successful academically and be self-learner. They will be given instructions on how to handle failure and probation issues. GPA (cumulative and semester) calculations and Ks consequences will be Introduced. Experts from different related fields will be invited to give lectures. | |||||||||||||||||||||||||||||||||||||||||
| AGR | This course introduces incoming students to the various majors and courses offered by the different departments in College of Agricultural and Marine Sciences. | |||||||||||||||||||||||||||||||||||||||||
| AGR | Introductory course in economic theory with applications to the food and natural resources sectors. The central theme of the course is how markets work and how prices are determined. Topics include supply and demand, production and costs, and the place of these sectors in the macroeconomy. | |||||||||||||||||||||||||||||||||||||||||
| AGR | The course will be begin by helping students to define problems to be studied, and reported orally and in writting. Ethical conduct in data collection, analysis & presentation will be emphasized. Finally , guidelines to make effective oral presentations and reporting will be taught. | |||||||||||||||||||||||||||||||||||||||||
| AGR | This course emphasizes the practical applications of statistical tools in looking at information and making decisions. The laboratory portion of the course introduces the student to the implementation of statistical methods using computers. | |||||||||||||||||||||||||||||||||||||||||
| ART | This course covers controlled vocabulary as reflected by lists of subject headings such as the Library of Congress Subject Headings and the Medical Subject Headings. It also covers uncontrolled vocabulary as well . | |||||||||||||||||||||||||||||||||||||||||
| ART | This course emphasizes the use of the Internet for medical professionals, therefore it covers topics as : concepts of the Internet, WWW, search tools, subject directories, search engines, meta search tools and evaluation of web page. Practical training in designing web homepage is required. | |||||||||||||||||||||||||||||||||||||||||
| ART | This course covers the use of the National Library of Medicine Classification System with an emphasis on the class QS-QZ and W-WZ as related to medicine and other related sciences. | |||||||||||||||||||||||||||||||||||||||||
| ART | This course will afford students the opportunity to learn how to design and implement small databases and to help them acquire the experience of the use of a computer as a tool for managing and processing information. Students will, then, become familiar with database packages such as XP Microsoft Access. |
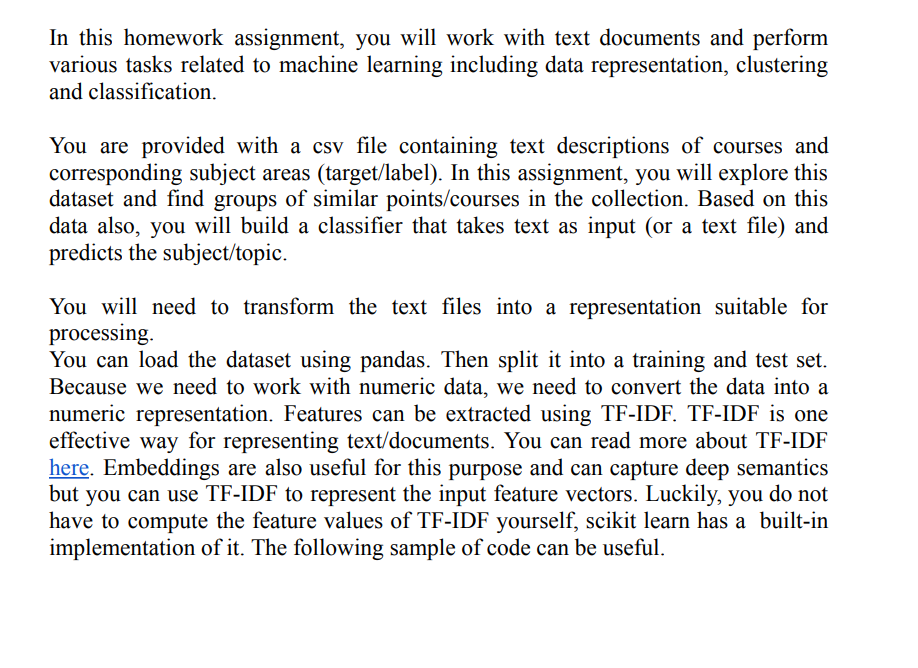
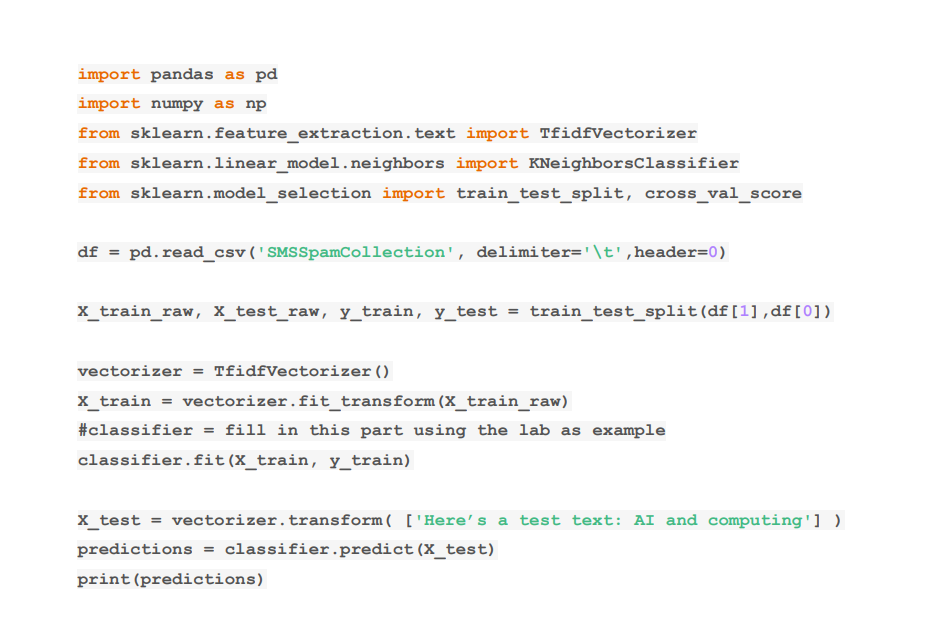
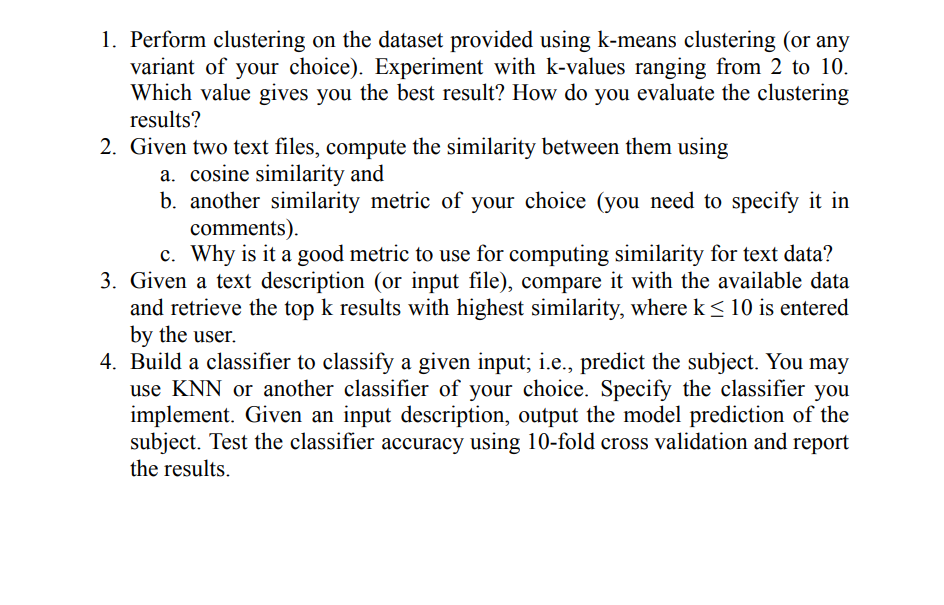
In this homework assignment, you will work with text documents and perform various tasks related to machine learning including data representation, clustering and classification. You are provided with a csv file containing text descriptions of courses and corresponding subject areas (target/label). In this assignment, you will explore this dataset and find groups of similar points/courses in the collection. Based on this data also, you will build a classifier that takes text as input (or a text file) and predicts the subject/topic. You will need to transform the text files into a representation suitable for processing. You can load the dataset using pandas. Then split it into a training and test set. Because we need to work with numeric data, we need to convert the data into a numeric representation. Features can be extracted using TF-IDF. TF-IDF is one effective way for representing text/documents. You can read more about TF-IDF here. Embeddings are also useful for this purpose and can capture deep semantics but you can use TF-IDF to represent the input feature vectors. Luckily, you do not have to compute the feature values of TF-IDF yourself, scikit learn has a built-in implementation of it. The following sample of code can be useful. import pandas as pd import numpy as np from sklearn.feature extraction.text import TfidfVectorizer from sklearn.linear_model.neighbors import KNeighborsClassifier from sklearn.model_selection import train_test_split, cross_val_score df = pd.read_csv('SMSSpamCollection', delimiter='\t', header=0) \( x_{\text {_train_raw, }} x_{\text {_test_raw, }} y_{\text {_train }} y_{\text {_ }} \) test = train_test_split (df[1],df[0]) vectorizer = TfidfVectorizer () x_train = vectorizer.fit_transform(x_train_raw) \#classifier = fill in this part using the lab as example classifier.fit(x_train, y_train) x_test = vectorizer.transform( ['Here's a test text: AI and computing'] ) predictions = classifier.predict \( \left(\mathbf{X}_{\text {_ }} ight. \) test ) print (predictions) 1. Perform clustering on the dataset provided using k-means clustering (or any variant of your choice). Experiment with k-values ranging from 2 to 10 . Which value gives you the best result? How do you evaluate the clustering results? 2. Given two text files, compute the similarity between them using a. cosine similarity and b. another similarity metric of your choice (you need to specify it in comments). c. Why is it a good metric to use for computing similarity for text data? 3. Given a text description (or input file), compare it with the available data and retrieve the top k results with highest similarity, where k10 is entered by the user. 4. Build a classifier to classify a given input; i.e., predict the subject. You may use KNN or another classifier of your choice. Specify the classifier you implement. Given an input description, output the model prediction of the subject. Test the classifier accuracy using 10 -fold cross validation and report the results. In this homework assignment, you will work with text documents and perform various tasks related to machine learning including data representation, clustering and classification. You are provided with a csv file containing text descriptions of courses and corresponding subject areas (target/label). In this assignment, you will explore this dataset and find groups of similar points/courses in the collection. Based on this data also, you will build a classifier that takes text as input (or a text file) and predicts the subject/topic. You will need to transform the text files into a representation suitable for processing. You can load the dataset using pandas. Then split it into a training and test set. Because we need to work with numeric data, we need to convert the data into a numeric representation. Features can be extracted using TF-IDF. TF-IDF is one effective way for representing text/documents. You can read more about TF-IDF here. Embeddings are also useful for this purpose and can capture deep semantics but you can use TF-IDF to represent the input feature vectors. Luckily, you do not have to compute the feature values of TF-IDF yourself, scikit learn has a built-in implementation of it. The following sample of code can be useful. import pandas as pd import numpy as np from sklearn.feature extraction.text import TfidfVectorizer from sklearn.linear_model.neighbors import KNeighborsClassifier from sklearn.model_selection import train_test_split, cross_val_score df = pd.read_csv('SMSSpamCollection', delimiter='\t', header=0) \( x_{\text {_train_raw, }} x_{\text {_test_raw, }} y_{\text {_train }} y_{\text {_ }} \) test = train_test_split (df[1],df[0]) vectorizer = TfidfVectorizer () x_train = vectorizer.fit_transform(x_train_raw) \#classifier = fill in this part using the lab as example classifier.fit(x_train, y_train) x_test = vectorizer.transform( ['Here's a test text: AI and computing'] ) predictions = classifier.predict \( \left(\mathbf{X}_{\text {_ }} ight. \) test ) print (predictions) 1. Perform clustering on the dataset provided using k-means clustering (or any variant of your choice). Experiment with k-values ranging from 2 to 10 . Which value gives you the best result? How do you evaluate the clustering results? 2. Given two text files, compute the similarity between them using a. cosine similarity and b. another similarity metric of your choice (you need to specify it in comments). c. Why is it a good metric to use for computing similarity for text data? 3. Given a text description (or input file), compare it with the available data and retrieve the top k results with highest similarity, where k10 is entered by the user. 4. Build a classifier to classify a given input; i.e., predict the subject. You may use KNN or another classifier of your choice. Specify the classifier you implement. Given an input description, output the model prediction of the subject. Test the classifier accuracy using 10 -fold cross validation and report the results
Step by Step Solution
There are 3 Steps involved in it

Get step-by-step solutions from verified subject matter experts