

Question: Show one example calculation for the potential energy, kinetic energy, and total energy of the falling ball. Be sure to use data at the time
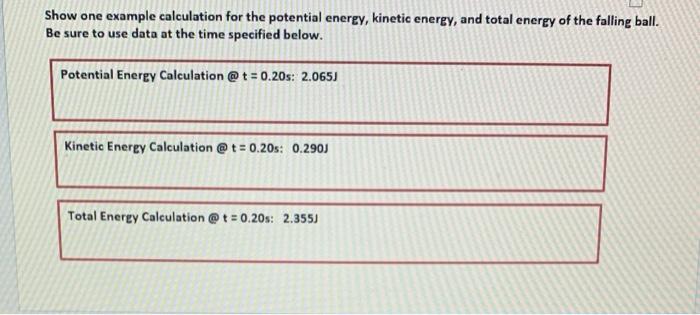
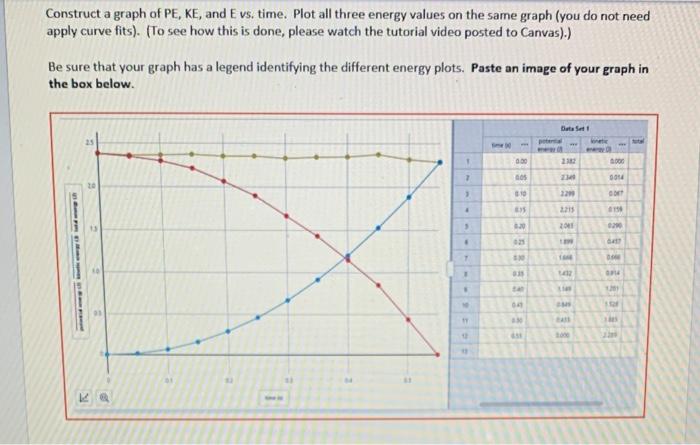
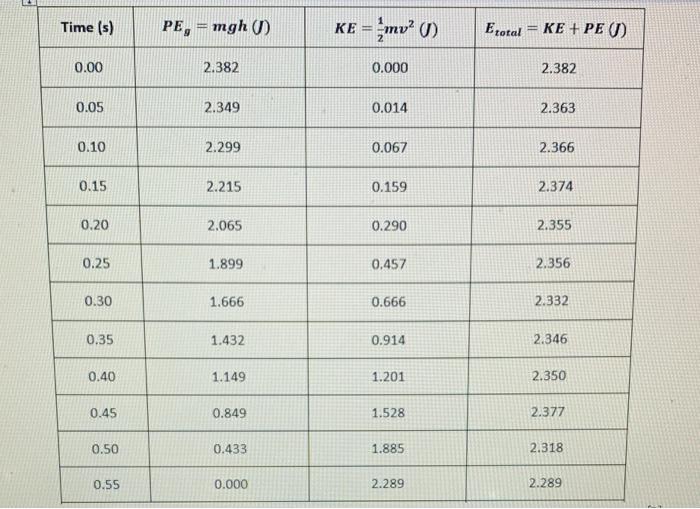
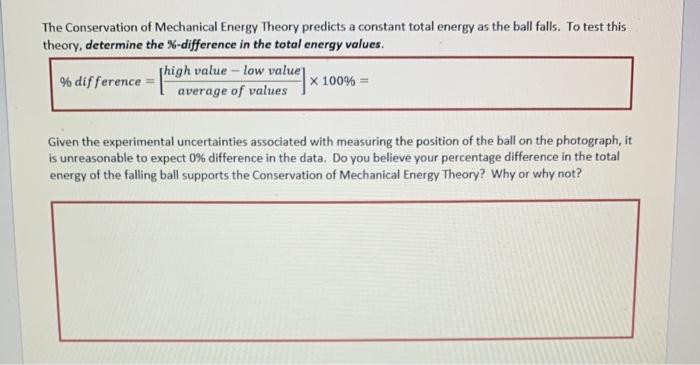
Show one example calculation for the potential energy, kinetic energy, and total energy of the falling ball. Be sure to use data at the time specified below. Construct a graph of PE, KE, and E vs, time. Plot all three energy values on the same graph (you do not need apply curve fits). (To see how this is done, please watch the tutorial video posted to Canvas).) Be sure that your graph has a legend identifying the different energy plots. Paste an image of your graph in the box below. \begin{tabular}{|c|c|c|c|} \hline Time (s) & PEg=mgh(J) & KE=21mv2(J) & Etotal=KE+PE(J) \\ \hline 0.00 & 2.382 & 0.000 & 2.382 \\ \hline 0.05 & 2.349 & 0.014 & 2.363 \\ \hline 0.10 & 2.299 & 0.067 & 2.366 \\ \hline 0.15 & 2.215 & 0.159 & 2.374 \\ \hline 0.20 & 2.065 & 0.290 & 2.355 \\ \hline 0.25 & 1.899 & 0.457 & 2.356 \\ \hline 0.30 & 1.666 & 0.666 & 2.332 \\ \hline 0.35 & 1.432 & 0.914 & 2.346 \\ \hline 0.40 & 1.149 & 1.201 & 2.350 \\ \hline 0.45 & 0.849 & 1.528 & 2.377 \\ \hline 0.50 & 0.433 & 1.885 & 2.318 \\ \hline 0.55 & 0.000 & 2.289 & 2.289 \\ \hline \end{tabular} The Conservation of Mechanical Energy Theory predicts a constant total energy as the ball falls. To test this theory, determine the %-difference in the total energy values. %difference=[averageofvalueshighvaluelowvalue]100%= Given the experimental uncertainties associated with measuring the position of the ball on the photograph, it is unreasonable to expect 0% difference in the data. Do you believe your percentage difference in the total energy of the falling ball supports the Conservation of Mechanical Energy Theory? Why or why not
Step by Step Solution
There are 3 Steps involved in it

Get step-by-step solutions from verified subject matter experts