

Question: Show specific prices for each brand and estimate demand (number of units sold) for each quarter. Use the prices and demand estimates to forecast sales
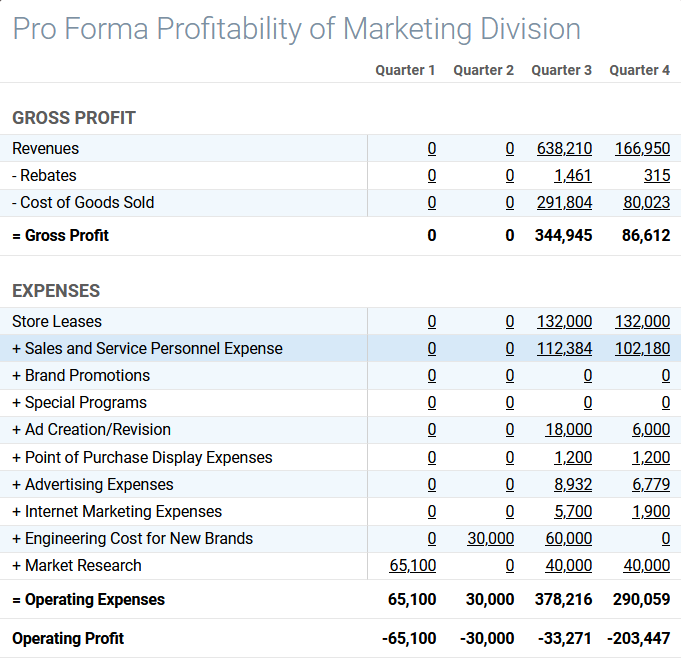
Show specific prices for each brand and estimate demand (number of units sold) for each quarter. Use the prices and demand estimates to forecast sales for each quarter. Display the resulting data on a pro forma profit and loss statement for Quarters 5-8.
Estimate costs for every category and display the resulting data on a pro forma profit and loss statement for Quarters 5-8. Project financial outcomes (gross profit, operating profit, net profit, and cumulative net profit) for Quarters 5-8 and display the results on a pro forma profit and loss statement for each quarter.
I'm not sure I can answer these two questions with the Data provided; can someone help please? Please let me know if more info is needed.
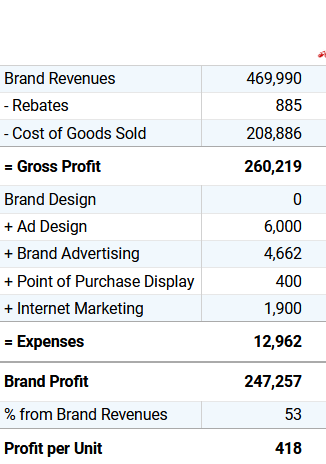
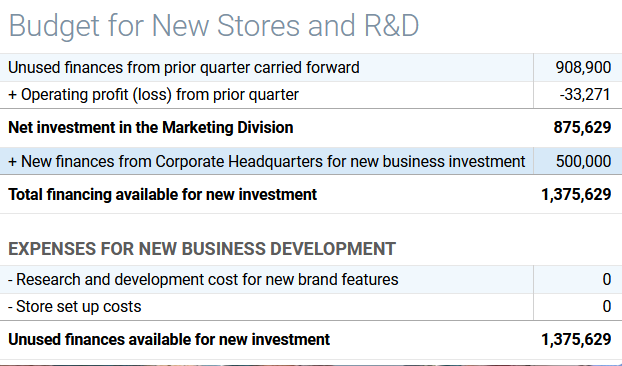
Brand Revenues - Rebates - Cost of Goods Sold 469,990 885 208,886 260,219 = Gross Profit Brand Design + Ad Design + Brand Advertising + Point of Purchase Display + Internet Marketing 6,000 4,662 400 1,900 = Expenses 12,962 Brand Profit 247,257 % from Brand Revenues 53 Profit per Unit 418 Budget for New Stores and R&D Unused finances from prior quarter carried forward + Operating profit (loss) from prior quarter Net investment in the Marketing Division 908,900 -33,271 875,629 + New finances from Corporate Headquarters for new business investment 500,000 Total financing available for new investment 1,375,629 EXPENSES FOR NEW BUSINESS DEVELOPMENT - Research and development cost for new brand features - Store set up costs 0 Unused finances available for new investment 1,375,629 Pro Forma Profitability of Marketing Division Quarter 1 Quarter 2 Quarter 3 Quarter 4 GROSS PROFIT Revenues - Rebates - Cost of Goods Sold 0 0 0 0 0 0 0 638,210 1.461 291,804 344,945 166.950 315 80,023 86,612 = Gross Profit EXPENSES Store Leases + Sales and Service Personnel Expense + Brand Promotions + Special Programs + Ad Creation/Revision + Point of Purchase Display Expenses + Advertising Expenses + Internet Marketing Expenses + Engineering Cost for New Brands + Market Research ololololololo 0 0 0 65,100 65,100 -65,100 0 0 0 0 0 0 0 0 30,000 0 30,000 -30,000 132,000 132,000 112,384 102,180 0 0 0 0 18.000 6,000 1,200 1,200 8.932 6,779 5,700 1,900 60,000 0 40,000 40,000 378,216 290,059 -33,271 -203,447 = Operating Expenses Operating Profit Brand Revenues - Rebates - Cost of Goods Sold 469,990 885 208,886 260,219 = Gross Profit Brand Design + Ad Design + Brand Advertising + Point of Purchase Display + Internet Marketing 6,000 4,662 400 1,900 = Expenses 12,962 Brand Profit 247,257 % from Brand Revenues 53 Profit per Unit 418 Budget for New Stores and R&D Unused finances from prior quarter carried forward + Operating profit (loss) from prior quarter Net investment in the Marketing Division 908,900 -33,271 875,629 + New finances from Corporate Headquarters for new business investment 500,000 Total financing available for new investment 1,375,629 EXPENSES FOR NEW BUSINESS DEVELOPMENT - Research and development cost for new brand features - Store set up costs 0 Unused finances available for new investment 1,375,629 Pro Forma Profitability of Marketing Division Quarter 1 Quarter 2 Quarter 3 Quarter 4 GROSS PROFIT Revenues - Rebates - Cost of Goods Sold 0 0 0 0 0 0 0 638,210 1.461 291,804 344,945 166.950 315 80,023 86,612 = Gross Profit EXPENSES Store Leases + Sales and Service Personnel Expense + Brand Promotions + Special Programs + Ad Creation/Revision + Point of Purchase Display Expenses + Advertising Expenses + Internet Marketing Expenses + Engineering Cost for New Brands + Market Research ololololololo 0 0 0 65,100 65,100 -65,100 0 0 0 0 0 0 0 0 30,000 0 30,000 -30,000 132,000 132,000 112,384 102,180 0 0 0 0 18.000 6,000 1,200 1,200 8.932 6,779 5,700 1,900 60,000 0 40,000 40,000 378,216 290,059 -33,271 -203,447 = Operating Expenses Operating Profit
Step by Step Solution
There are 3 Steps involved in it

Get step-by-step solutions from verified subject matter experts