

Question: Show the minimum size loan that would be needed to support the company and that the company can afford. Show as much work, data analysis
Show the minimum size loan that would be needed to support the company and that the company can afford. Show as much work, data analysis as you can.
| Exhibit 2 Balance Sheets, 2012-2013 (thousands of dollars) | ||||||||||
| 2012 | 2013 | |||||||||
| August | September | October | November | December | January | February | March | April | May | |
| Cash | 8,350 | 3,328 | 3,523 | 4,511 | 4,239 | 4,878 | 5,182 | 3,962 | 6,277 | 4,994 |
| Accounts receivablea | 5,793 | 5,969 | 6,421 | 5,851 | 6,009 | 6,170 | 5,606 | 5,197 | 3,365 | 3,744 |
| Inventory | 7,154 | 7,364 | 7,524 | 7,219 | 7,277 | 7,097 | 7,529 | 8,371 | 11,234 | 12,163 |
| Current assets | 21,297 | 16,661 | 17,468 | 17,581 | 17,525 | 18,145 | 18,317 | 17,530 | 20,876 | 20,901 |
| Gross PP&E | 45,500 | 45,500 | 45,500 | 45,500 | 45,500 | 45,500 | 45,500 | 45,500 | 45,500 | 45,500 |
| Accumulated depreciationb | 30,368 | 30,488 | 30,608 | 30,728 | 30,848 | 30,968 | 31,088 | 31,208 | 31,328 | 31,448 |
| Net PP&E | 15,132 | 15,012 | 14,892 | 14,772 | 14,652 | 14,532 | 14,412 | 14,292 | 14,172 | 14,052 |
| Prepaid expenses | 242 | 58 | 23 | 45 | 47 | 52 | 65 | 46 | 46 | 54 |
| Total assets | 36,671 | 31,731 | 32,383 | 32,398 | 32,224 | 32,729 | 32,794 | 31,868 | 35,094 | 35,007 |
| Accounts payablec | 4,977 | 5,197 | 5,347 | 5,352 | 5,110 | 5,130 | 5,162 | 5,122 | 6,223 | 5,969 |
| Notes payable, bank | 0 | 5,000 | 5,000 | 5,000 | 5,000 | 5,000 | 5,000 | 5,000 | 5,000 | 5,000 |
| Accrued taxesd | 252 | 4 | 174 | 331 | 107 | 269 | 417 | 140 | 216 | 273 |
| Other accrued expenses | 1,500 | 1,542 | 1,542 | 1,542 | 1,542 | 1,542 | 1,542 | 1,142 | 1,142 | 1,142 |
| Customer advance payments | 1,651 | 1,651 | 1,651 | 1,200 | 1,200 | 1,200 | 800 | 800 | 2,700 | 2,700 |
| Current liabilities | 8,380 | 13,394 | 13,714 | 13,425 | 12,959 | 13,141 | 12,921 | 12,204 | 15,281 | 15,084 |
| Shareholders' equity | 28,291 | 18,337 | 18,668 | 18,973 | 19,265 | 19,588 | 19,874 | 19,664 | 19,813 | 19,923 |
| Total liabilities and equity | 36,671 | 31,731 | 32,383 | 32,398 | 32,224 | 32,729 | 32,794 | 31,868 | 35,094 | 35,007 |
| a Selling term of net 30 days. | ||||||||||
| b Depreciation of $120,000 per month. | ||||||||||
| c Purchase terms of net 30 days. | ||||||||||
| d Outstanding taxes on 2012 fiscal year income were due January 15, 2013. On December 15, 2011, March 15, 2012, June 15, 2012, and September 15, 2012, payments of 25% of each of the estimated tax for 2012 ($1,500,000) were due. Taxes payable for 2013 were assumed to be $1,500,000 and would be paid on December 15, 2012, March 15, 2013, June 15, 2013, and September 15, 2013, in equal increments. | ||||||||||
| -9,954 | ||||||||||
| 18,337 |
| |||||||||
| Exhibit 3 Income Statements, 2012-2013 (thousands of dollars) | ||||||||||||
| 2012 August | 2012 September | Fiscal Year Ending 09/30/2012 | 2012 October | 2012 November | 2012 December | 2013 January | 2013 February | 2013 March | 2013 April | 2013 May | Eight Months Total | |
| Net sales | 6,321 | 5,969 | 71,642 | 6,421 | 6,302 | 6,009 | 6,170 | 6,006 | 5,197 | 4,165 | 3,744 | 44,014 |
| COGS | 4,994 | 4,727 | 56,955 | 5,003 | 4,914 | 4,695 | 4,815 | 4,692 | 4,087 | 3,215 | 2,876 | 34,297 |
| Gross profit | 1,327 | 1,242 | 14,687 | 1,418 | 1,388 | 1,314 | 1,355 | 1,314 | 1,110 | 950 | 868 | 9,717 |
| Operating expenses | 773 | 763 | 9,509 | 777 | 788 | 733 | 728 | 744 | 685 | 587 | 566 | 5,608 |
| Depreciation and amortization | 120 | 120 | 1,440 | 120 | 120 | 120 | 120 | 120 | 120 | 120 | 120 | 960 |
| Interest expensea | 0 | 0 | 0 | 25 | 25 | 25 | 25 | 25 | 25 | 25 | 25 | 200 |
| Interest incomeb | 13 | 14 | 120 | 6 | 6 | 8 | 7 | 8 | 9 | 7 | 10 | 60 |
| Profit (loss) before tax | 447 | 373 | 3,858 | 502 | 461 | 443 | 489 | 433 | 289 | 225 | 167 | 3,009 |
| Income taxesc | 152 | 127 | 1,312 | 171 | 157 | 151 | 166 | 147 | 98 | 76 | 57 | 1,023 |
| Net income | 295 | 246 | 2,546 | 331 | 304 | 293 | 323 | 286 | 191 | 148 | 111 | 1,986 |
| Dividends | 0 | 200 | 400 | 0 | 0 | 0 | 0 | 0 | 400 | 0 | 0 | 400 |
| a 6% annualized interest rate charged on outstanding bank loans. | ||||||||||||
| b 2% annualized rate of return on beginning monthly cash balances. | ||||||||||||
| c The federal tax rate on all earnings was 34%. | ||||||||||||
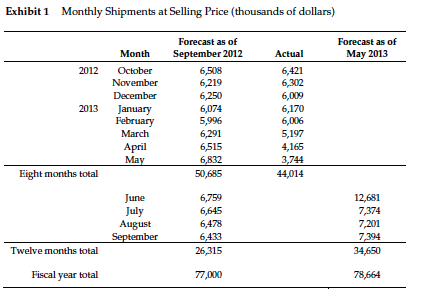
Jackson Automotive Systems It was early June 2013. Heather James, vice president at the Michigan State Bank, was considering a loan request from a longtime client, Jackson Automotive Systems. Jackson had requested the renewal of an existing term loan with the bank in the amount of $5 million that was originally scheduled to be repaid at the end of the month. Jackson was also seeking to borrow an additional $2.4 million to fund the acquisition of a long-needed piece of equipment, which it planned to purchase in late July. Both loans, which totaled $7.4 million, would be repayable on September 30, 2013 Jackson Automotive Systems, an Original Equipment Manufacturer (OEM) located in Jackson, Michigan, carried product lines in advanced heating and air conditioning systems, engine cooling systems and parts, and fuel injection and transfer systems, as well as various other engine parts. Production of these lines required sophisticated and expensive precision equipment. The company's customers were relable and reputable automotive assemblers located nearby in the Michigan area. Industry Background At the time of the loan in 2013, there were over 5,000 automotive parts suppliers located in the U.S. Less than 200 companies had annual sales of more than $100 million, while the remaining companies were small producers, representing a highly fragmented market. Small private companies, such as Jackson Automotive Systems, had specialized production lines and relied on sales to local customers. Given the location of the "big three" U.S. automotive companies, the state of Michigarn hosted the l argest presence of OEMs in comparison to the rest of the country The U.S. OEMs experienced a severe slump in production after the 2008 financial crisis, with sales dropping more than 30%. Many suppliers managed to survive the economic downturn by rationing capacity and production. The industry was running at about 55% capacity during the financial crisis. Traditional products that required low-skill labor had already had their production shifted to Asia. Overseas producers from countries such as China and India were increasingly competing for U.S. market share, with any gains coming at the expenses of U.S. manufacturing participants. This fierce competition, coupled with higher cost structures, forced a number of U.S. OEMs into bankruptcy Fortunately, the industry had rebounded since 2010 and had since returned to profitability in 2011. However, given the slow economic recovery and the high prices of raw materials, competition was still fierce
Step by Step Solution
There are 3 Steps involved in it

Get step-by-step solutions from verified subject matter experts