

Question: Show the solution, too. Styles ding URE Rew capital structure, you would like to create a pie chart. Another pie chart that is available is
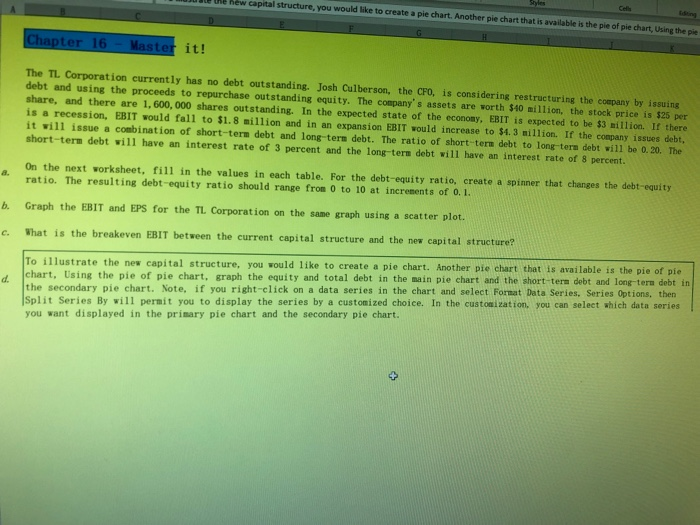
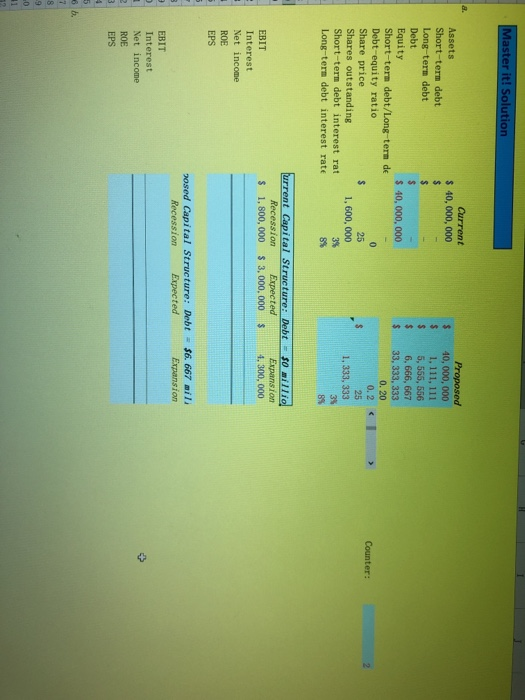

Styles ding URE Rew capital structure, you would like to create a pie chart. Another pie chart that is available is the pie of pie chart, Using the pie A Chapter 16- Master it! The TL Corporation currently has no debt outstanding. Josh Culberson, the CFO, is considering restructuring the company by issuing debt and using the proceeds to repurchase out standing equity. The company's assets are worth $40 million, the stock price is $25 per share, and there are 1, 600, 000 shares outstanding. In the expected state of the economy, EBIT is expected to be $3 million. If there is a recession, EBIT would fall to $1.8 million and in an expansion EBIT would increase to $4. 3 million. If the company issues debt, it will issue a combination of short-tern debt and long-term debt. The ratio of short-tern debt to long term debt will be 0. 20. The short-term debt will have an interest rate of 3 percent and the long-term debt will have an interest rate of 8 percent. On the next worksheet, fill in the values in each table. For the debt-equity ratio, create a spinner that changes the debt-equity ratio. The resulting debt-equity ratio should range from 0 to 10 at increments of 0.1. a. Graph the EBIT and EPS for the TL Corporation on the same graph using a scatter plot. b. What is the breakeven EBIT between the current capital structure and the new capital structure? c. chart, Using the pie of pie chart, graph the equity and total debt in the main pie chart and the short-tern debt and long tern debt in d. the secondary pie chart. Note, if you right-click on a data series in the chart and select Format Data Series, Series Options, then To illustrate the new capital structure, you would like to create a pie chart. Another pie chart that is available is the pie of pie Split Series By wil1 permit you to display the series by a customized choice. In the custonization, you can select which data series you want displayed in the primary pie chart and the secondary pie chart. Master it! Solution Current Proposed 40, 000, 000 1, 111, 111 5, 555, 556 Assets $ 40, 000, 000 $ Short-term debt S Long-term debt. Debt S $ 6, 666, 667 33, 333, 333 Equity Short-term debt/Long-term de Debt-equity ratio Share price Shares outstanding Short-term debt interest rat $ 40, 000, 000 $ 0. 20 0.2 Counter: 25 $ 1, 333, 333 25 1, 600, 000 3% 3% Long-term debt interest rate 8% urrent Capital Structure: Debt $0 millio Expansion 4, 300, 000 Recession Expected EBIT 1, 800, 000 S 3, 000, 000 $ Interest Net income ROE EPS 2osed Capital Structure: Debt $6. 667 aili Recession Expected Expansion EBIT Interest Net income ROE EPS 2. 3 4 5 6 b. 7 8 9 6 b. 3 1 2 3 4 5 7 2 c. Breakeven EBIT 3 4 d. 5 6 7 8 70 71 72 73 Styles ding URE Rew capital structure, you would like to create a pie chart. Another pie chart that is available is the pie of pie chart, Using the pie A Chapter 16- Master it! The TL Corporation currently has no debt outstanding. Josh Culberson, the CFO, is considering restructuring the company by issuing debt and using the proceeds to repurchase out standing equity. The company's assets are worth $40 million, the stock price is $25 per share, and there are 1, 600, 000 shares outstanding. In the expected state of the economy, EBIT is expected to be $3 million. If there is a recession, EBIT would fall to $1.8 million and in an expansion EBIT would increase to $4. 3 million. If the company issues debt, it will issue a combination of short-tern debt and long-term debt. The ratio of short-tern debt to long term debt will be 0. 20. The short-term debt will have an interest rate of 3 percent and the long-term debt will have an interest rate of 8 percent. On the next worksheet, fill in the values in each table. For the debt-equity ratio, create a spinner that changes the debt-equity ratio. The resulting debt-equity ratio should range from 0 to 10 at increments of 0.1. a. Graph the EBIT and EPS for the TL Corporation on the same graph using a scatter plot. b. What is the breakeven EBIT between the current capital structure and the new capital structure? c. chart, Using the pie of pie chart, graph the equity and total debt in the main pie chart and the short-tern debt and long tern debt in d. the secondary pie chart. Note, if you right-click on a data series in the chart and select Format Data Series, Series Options, then To illustrate the new capital structure, you would like to create a pie chart. Another pie chart that is available is the pie of pie Split Series By wil1 permit you to display the series by a customized choice. In the custonization, you can select which data series you want displayed in the primary pie chart and the secondary pie chart. Master it! Solution Current Proposed 40, 000, 000 1, 111, 111 5, 555, 556 Assets $ 40, 000, 000 $ Short-term debt S Long-term debt. Debt S $ 6, 666, 667 33, 333, 333 Equity Short-term debt/Long-term de Debt-equity ratio Share price Shares outstanding Short-term debt interest rat $ 40, 000, 000 $ 0. 20 0.2 Counter: 25 $ 1, 333, 333 25 1, 600, 000 3% 3% Long-term debt interest rate 8% urrent Capital Structure: Debt $0 millio Expansion 4, 300, 000 Recession Expected EBIT 1, 800, 000 S 3, 000, 000 $ Interest Net income ROE EPS 2osed Capital Structure: Debt $6. 667 aili Recession Expected Expansion EBIT Interest Net income ROE EPS 2. 3 4 5 6 b. 7 8 9 6 b. 3 1 2 3 4 5 7 2 c. Breakeven EBIT 3 4 d. 5 6 7 8 70 71 72 73
Step by Step Solution
There are 3 Steps involved in it

Get step-by-step solutions from verified subject matter experts