

Question: Show work: A, B, C, D After: Put it together and wri te your sine and cosine functions Paragraph Styles Modified Trigonometry of Temperature Portfolio
Show work: A, B, C, D After: Put it together and wri te your sine and cosine functions
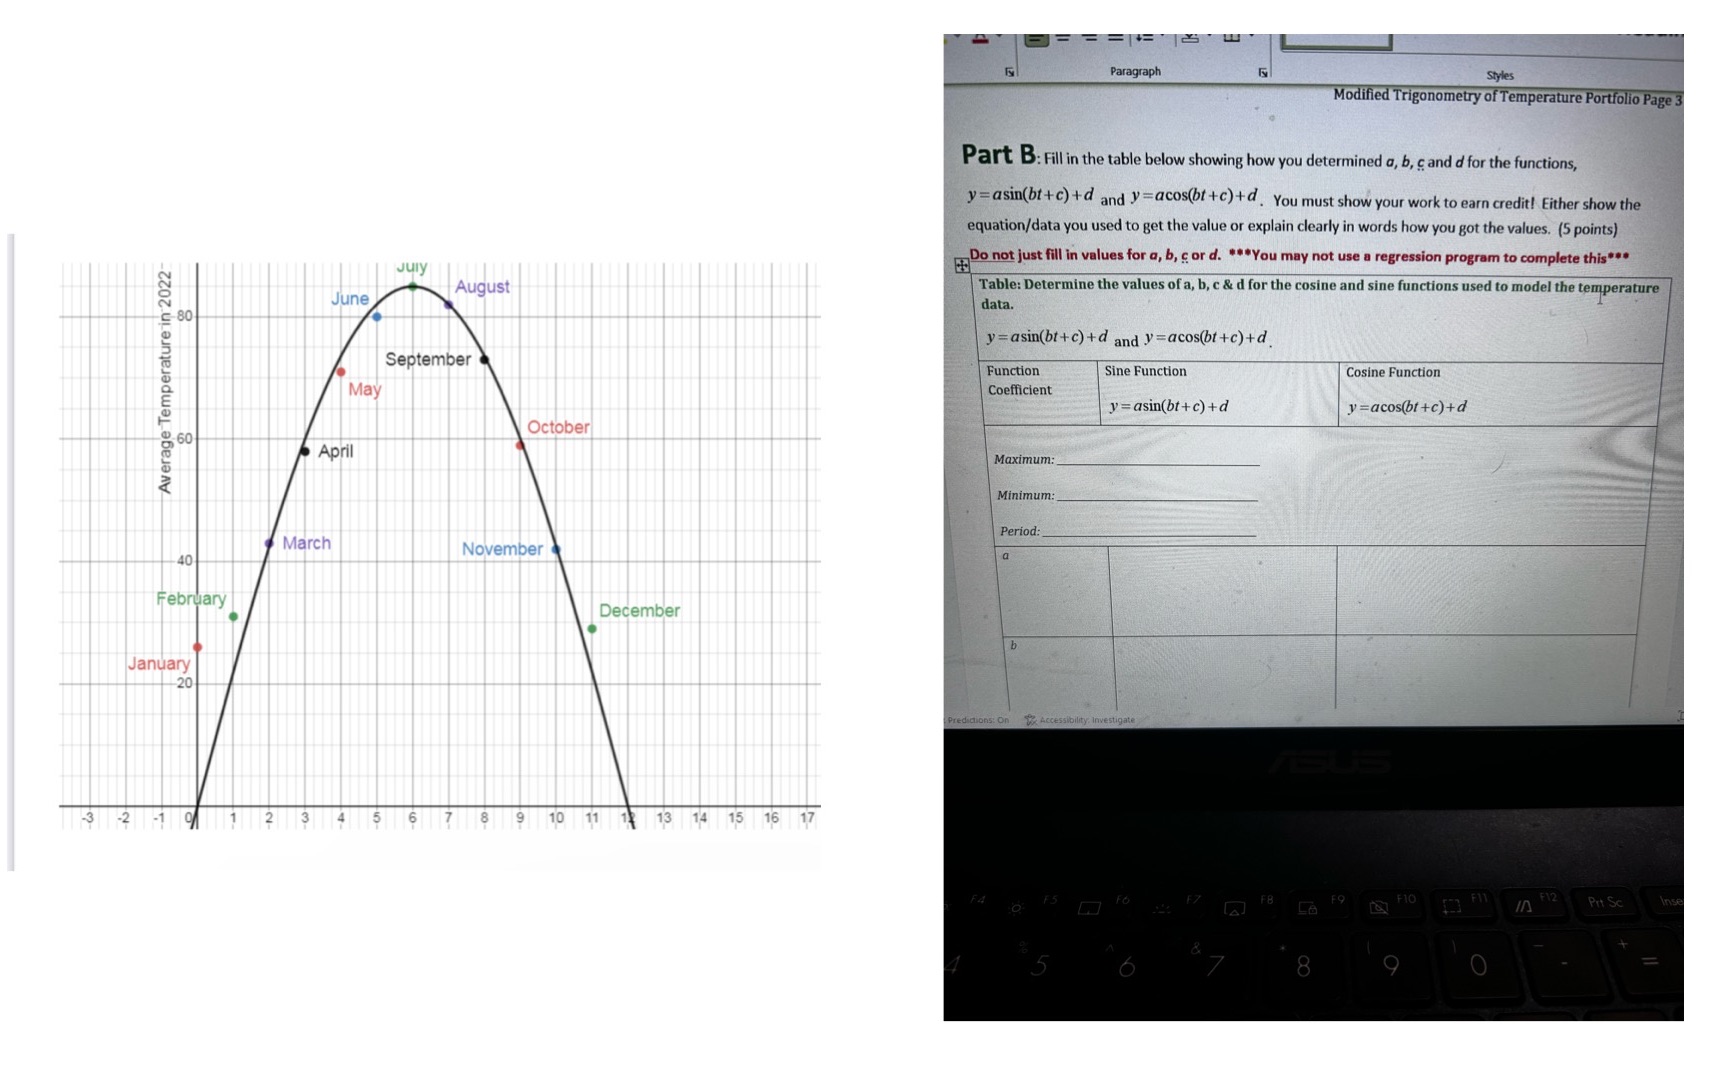
Paragraph Styles Modified Trigonometry of Temperature Portfolio Page 3 Part B: Fill in the table below showing how you determined a, b, c and d for the functions, y = asin(bt+c) +d and y=acos(bi +c)+d. You must show your work to earn credit! Either show the equation/data you used to get the value or explain clearly in words how you got the values. (5 points) Do not just fill in values for a, b, cord. *You may not use a regression program to complete this"" July August Table: Determine the values of a, b, c & d for the cosine and sine functions used to model the temperature June data. -80 y = asin(bt+c) +d and y =acos(bt+c) +d. September Function Sine Function Cosine Function Average Temperature in 2022 May Coefficient y = asin(bf+ c) +d y =acos(bt +c)+d October -60 April Maximum: Minimum: Period March November 40 February December b January -20 ons: On Accessibility. Invest 3 -2 -1 9 10 11 1 13 14 15 16 17 F4 F5 FO FZ F8 F9 F10 F12 Pit Sc O 8
Step by Step Solution
There are 3 Steps involved in it

Get step-by-step solutions from verified subject matter experts