

Question: Show work A Moving to the next question prevents changes to this answer. estion 28 Questions 5.27-5.30 refer to the following situation: Suppose in a
Show work
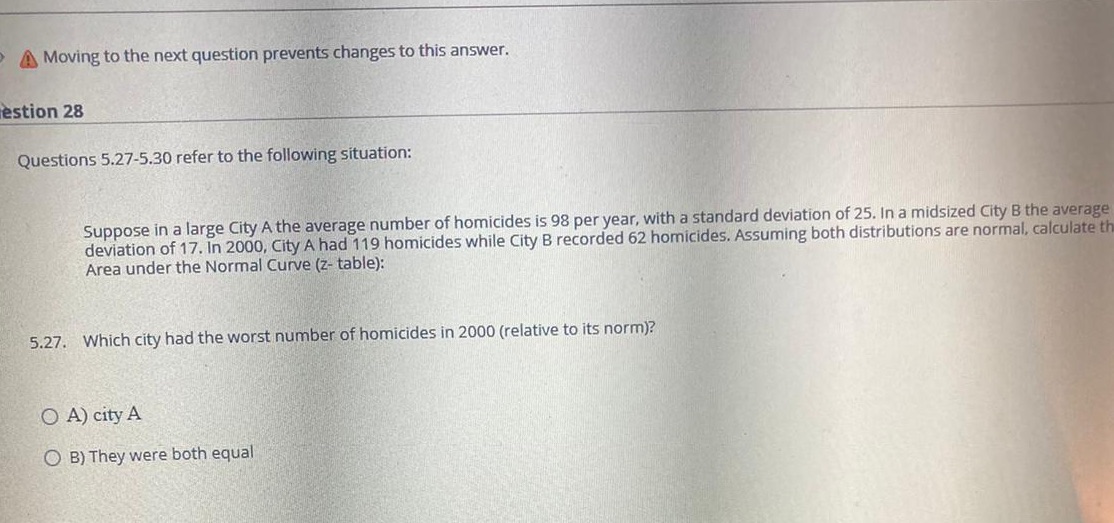
A Moving to the next question prevents changes to this answer. estion 28 Questions 5.27-5.30 refer to the following situation: Suppose in a large City A the average number of homicides is 98 per year, with a standard deviation of 25. In a midsized City B the average deviation of 17. In 2000, City A had 119 homicides while City B recorded 62 homicides. Assuming both distributions are normal, calculate th Area under the Normal Curve (z- table): 5.27. Which city had the worst number of homicides in 2000 (relative to its norm)? O A) city A O B) They were both equal
Step by Step Solution
There are 3 Steps involved in it
1 Expert Approved Answer
Step: 1 Unlock

Question Has Been Solved by an Expert!
Get step-by-step solutions from verified subject matter experts
Step: 2 Unlock
Step: 3 Unlock