

Question: Show work and screenshot of data table. Do not hand write the answer! Here is the information to create the spreadsheet needed for above Problem
Show work and screenshot of data table. Do not hand write the answer!
Here is the information to create the spreadsheet needed for above
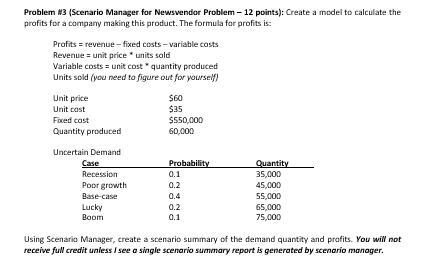
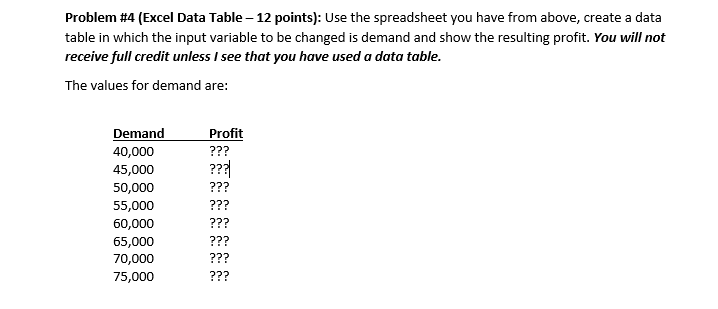
Problem #4 (Excel Data Table - 12 points): Use the spreadsheet you have from above, create a data table in which the input variable to be changed is demand and show the resulting profit. You will not receive full credit unless I see that you have used a data table. The values for demand are: Demand 40,000 45,000 50,000 55,000 60,000 65,000 70,000 75,000 Profit ??? ??? ??? ??? ??? ??? ??? ??? Problem #3 (Scenario Manager for Newsvendor Problem - 12 points): Create a model to calculate the profits for a company making this product. The formula for profits is: Profits = revenue - fixed costs - variable costs Revenue = unit price units sold Variable costs = unit cost quantity praduced Units sold you need to figure out for yourself) Unit price Unit cost Foved cost Quantity produced $60 $35 $550,000 60,000 Probability 0.1 Uncertain Demand Case Recession Poor growth Base-case Lucky Boom 0.2 Quantity 35,000 45,000 55,000 65,000 75,000 0.2 0.1 Using Scenario Manager, create a scenario summary of the demand quantity and profits. You will not receive full credit unless I see a single scenario summary report is generated by scenario manager. Problem #4 (Excel Data Table - 12 points): Use the spreadsheet you have from above, create a data table in which the input variable to be changed is demand and show the resulting profit. You will not receive full credit unless I see that you have used a data table. The values for demand are: Demand 40,000 45,000 50,000 55,000 60,000 65,000 70,000 75,000 Profit ??? ??? ??? ??? ??? ??? ??? ??? Problem #3 (Scenario Manager for Newsvendor Problem - 12 points): Create a model to calculate the profits for a company making this product. The formula for profits is: Profits = revenue - fixed costs - variable costs Revenue = unit price units sold Variable costs = unit cost quantity praduced Units sold you need to figure out for yourself) Unit price Unit cost Foved cost Quantity produced $60 $35 $550,000 60,000 Probability 0.1 Uncertain Demand Case Recession Poor growth Base-case Lucky Boom 0.2 Quantity 35,000 45,000 55,000 65,000 75,000 0.2 0.1 Using Scenario Manager, create a scenario summary of the demand quantity and profits. You will not receive full credit unless I see a single scenario summary report is generated by scenario manager
Step by Step Solution
There are 3 Steps involved in it

Get step-by-step solutions from verified subject matter experts