

Question: show work on excel 5. (10 Points) Create a fraction nonconforming chart p for this data with varying sample size. Assume you can address the
show work on excel
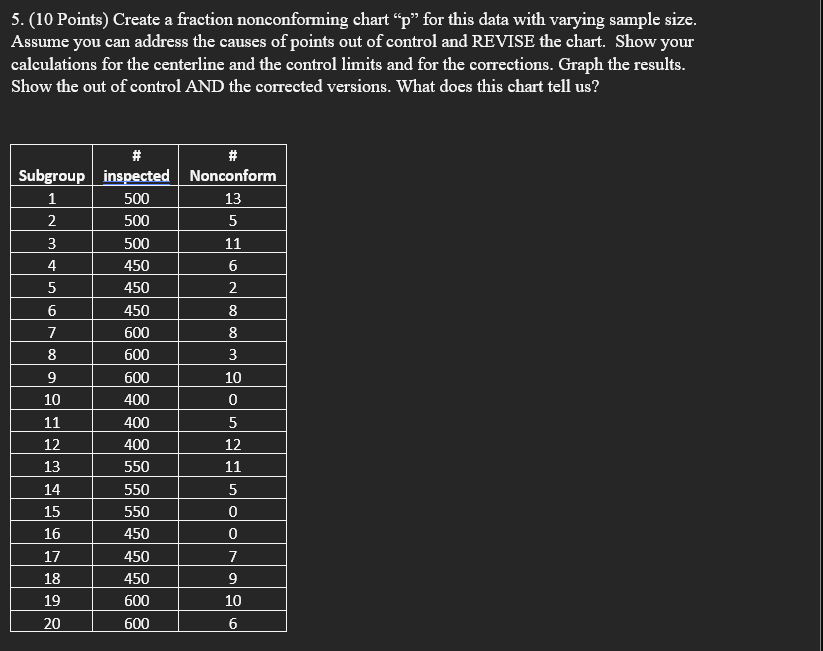
5. (10 Points) Create a fraction nonconforming chart p for this data with varying sample size. Assume you can address the causes of points out of control and REVISE the chart. Show your calculations for the centerline and the control limits and for the corrections. Graph the results. Show the out of control AND the corrected versions. What does this chart tell us? 3 # # Subgroup inspected Nonconform 1 500 13 2 500 5 3 500 11 4 450 6 5 450 2 6 450 8 7 600 8 600 3 9 600 10 10 400 0 11 400 5 12 400 12 13 550 11 14 550 5 15 550 0 16 450 0 17 450 7 18 450 19 600 10 20 600 al 90Step by Step Solution
There are 3 Steps involved in it
1 Expert Approved Answer
Step: 1 Unlock

Question Has Been Solved by an Expert!
Get step-by-step solutions from verified subject matter experts
Step: 2 Unlock
Step: 3 Unlock