

Question: Shown below are five NMR spectra for five different C 6 H 10 O 2 compounds. For each spectrum, draw the structure of the compound,
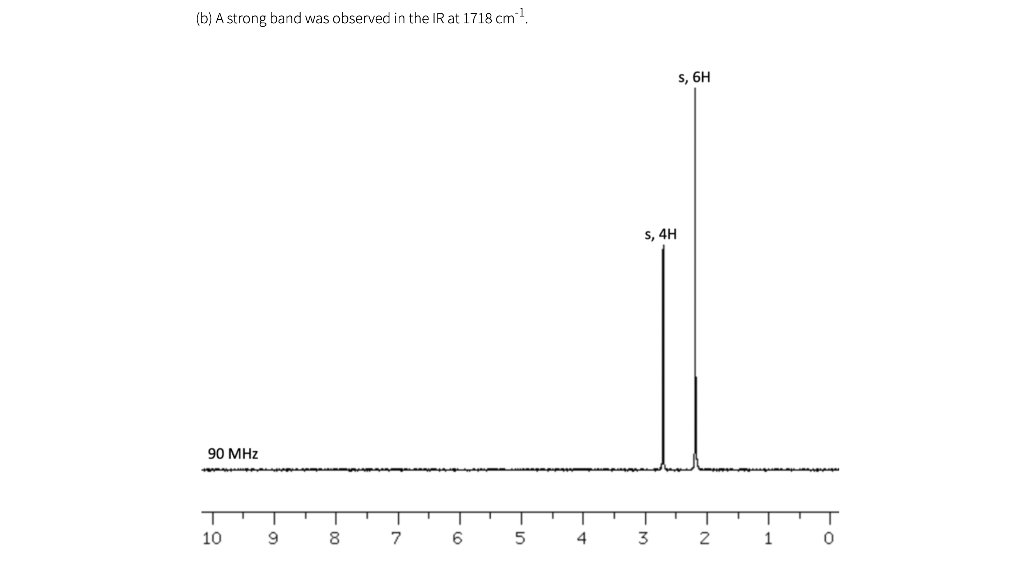
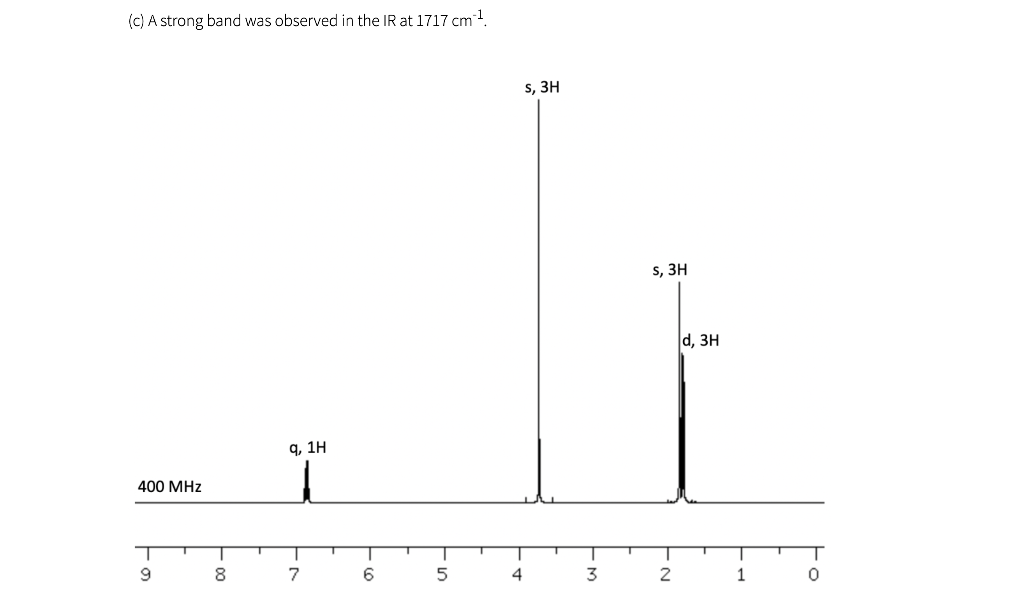
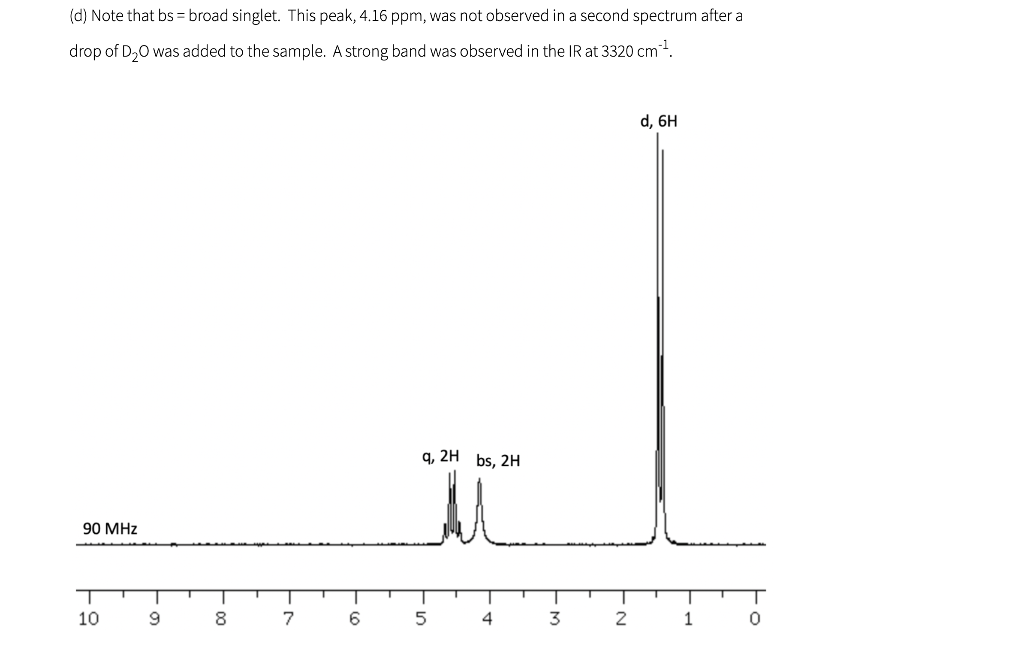
Shown below are five NMR spectra for five different C6H10O2 compounds. For each spectrum, draw the structure of the compound, and assign the spectrum by labeling H's in your structure (or in a second drawing of the structure) with the chemical shifts of the corresponding signals (which can be estimated to nearest 0.1 ppm). IR information is also provided. As a reminder, a peak near 1700 cm-1 is consistent with the presence of a carbonyl (C=O), and a peak near 3300 cm-1 is consistent with the presence of an OH.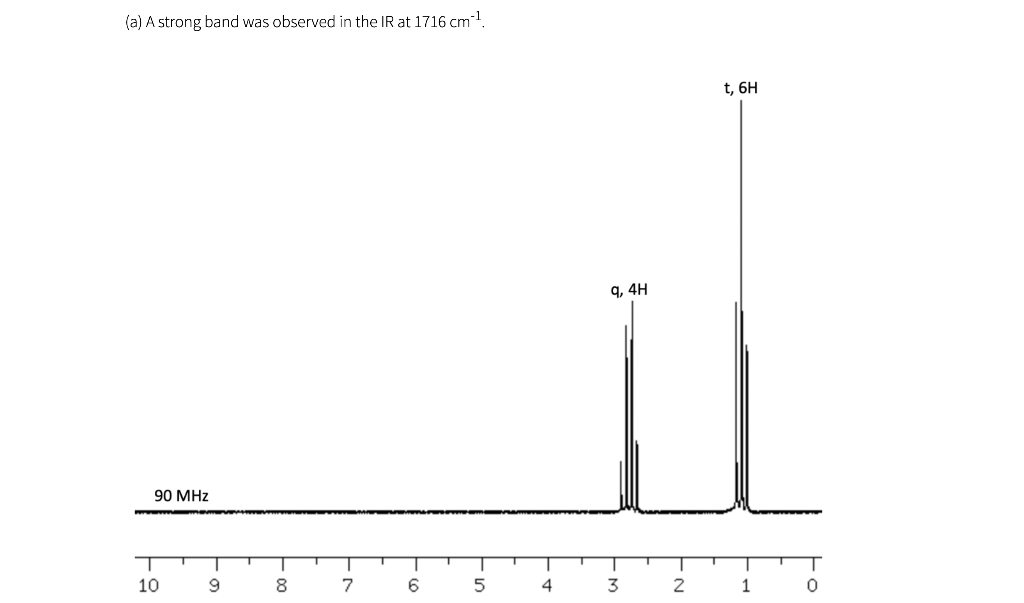

(f) The spectra in (a) and (e) both have triplets near 1 ppm, and the J values are about the same (about 7 Hz). Why does the pattern in (a) look so much wider?
Please Help, thank you.
(a) A strong band was observed in the IR at 1716 cm-1 t, 6H 9,4H 90 MHz 10 9 8 7 6 5 4 3 2 1 (b) A strong band was observed in the IR at 1718 cm 1 s, 6H S, 4H 90 MHz 10 9 T 0 8 7 6 5 4 3 2 1 (c) A strong band was observed in the IR at 1717 cm 1 S, 3H s, 3H d, 3H q, 1H 400 MHz T T T T T 9 1 7 | 5 1 4 1 3 T 0 -N 8 6 2 1 (d) Note that bs= broad singlet. This peak, 4.16 ppm, was not observed in a second spectrum after a drop of D.O was added to the sample. A strong band was observed in the IR at 3320 cm-1 d, 6H q, 2H bs, 2H mu 90 MHz T 10 9 00 7 6 5 4 3 2 1 0 le) A strong band was observed in the IR at 1717 cm 1 s, 3H t, 3H t, 2H h, 2H 300 MHz T 1 9 1 8 I 7 1 1 6 5 4 3 2 0 (f) The spectra in (a) and (e) both have triplets near 1 ppm, and the values are about the same (about 7 Hz). Why does the pattern in (a) look so much wider
Step by Step Solution
There are 3 Steps involved in it

Get step-by-step solutions from verified subject matter experts