

Question: Shown below are the forecasted quarterly demands ( i . e . sales plan ) for a product in 2 0 2 3 : Q
Shown below are the forecasted quarterly demands ie sales plan for a product in :
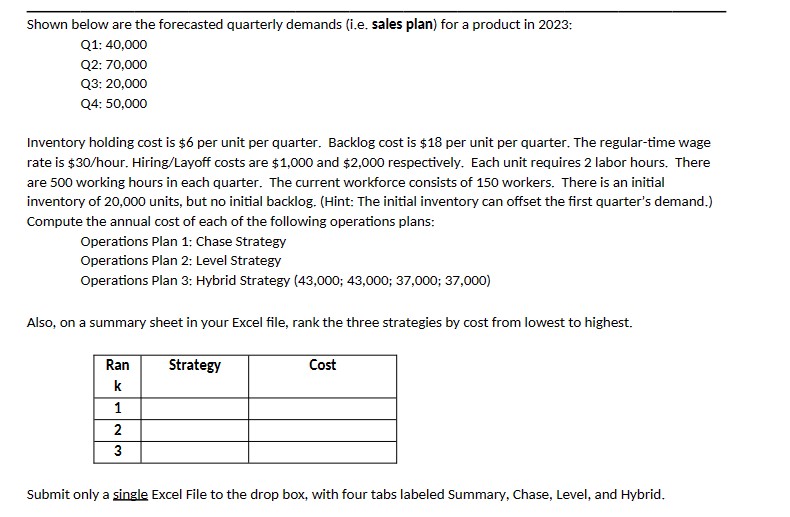
Q:
Q:
Q:
Q:
Inventory holding cost is $ per unit per quarter. Backlog cost is $ per unit per quarter. The regulartime wage
rate is $hour HiringLayoff costs are $ and $ respectively. Each unit requires labor hours. There
are working hours in each quarter. The current workforce consists of workers. There is an initial
inventory of units, but no initial backlog. Hint: The initial inventory can offset the first quarter's demand.
Compute the annual cost of each of the following operations plans:
Operations Plan : Chase Strategy
Operations Plan : Level Strategy
Operations Plan : Hybrid Strategy ;;;
Also, on a summary sheet in your Excel file, rank the three strategies by cost from lowest to highest.
excel with four tabs labeled Summary, Chase, Level, and Hybrid.
Step by Step Solution
There are 3 Steps involved in it
1 Expert Approved Answer
Step: 1 Unlock

Question Has Been Solved by an Expert!
Get step-by-step solutions from verified subject matter experts
Step: 2 Unlock
Step: 3 Unlock