

Question: Shown below is a scatter plot of y versus x. 60 50 40 30 20 10 0 -10 0 5 10 15 20 25 X

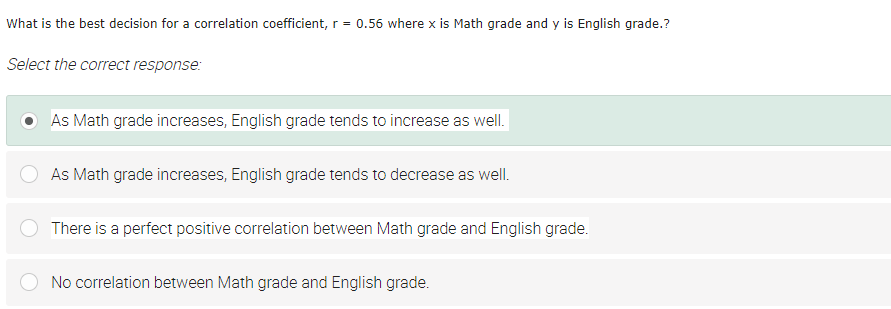
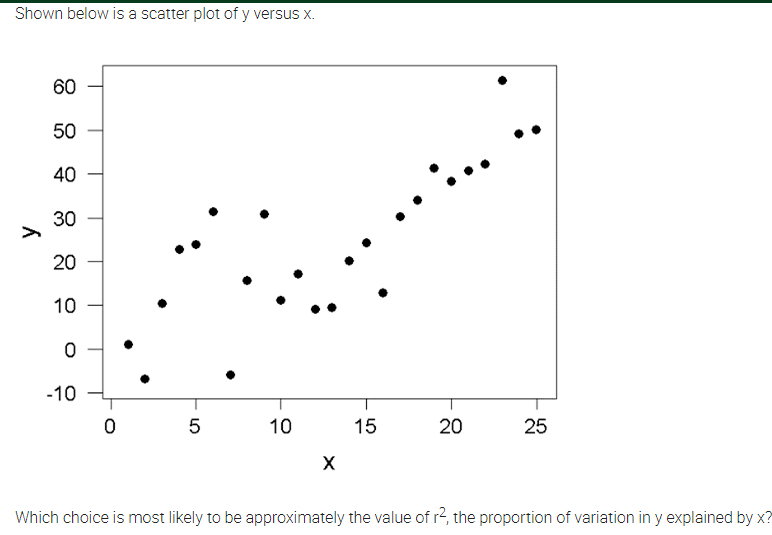

Shown below is a scatter plot of y versus x. 60 50 40 30 20 10 0 -10 0 5 10 15 20 25 X Which choice is most likely to be approximately the value of ra, the proportion of variation in y explained by xWhat is the best decision for a correlation coefficient, r = 0.56 where x is Math grade and y is English grade.? Select the correct response: O As Math grade increases, English grade tends to increase as well. O As Math grade increases, English grade tends to decrease as well. O There is a perfect positive correlation between Math grade and English grade. O No correlation between Math grade and English grade
Step by Step Solution
There are 3 Steps involved in it
1 Expert Approved Answer
Step: 1 Unlock

Question Has Been Solved by an Expert!
Get step-by-step solutions from verified subject matter experts
Step: 2 Unlock
Step: 3 Unlock